 Global| Jan 15 2010
CPI's 2009 Decline Is First Since1955
by:Tom Moeller
|in:Economy in Brief
Summary
Some said earlier that it wouldn't happen, but last year it did. For all of 2009, consumer prices declined slightly. The 0.3% drop, the first since 1955, was pulled lower by a decline in energy prices. Since the energy price decline, [...]
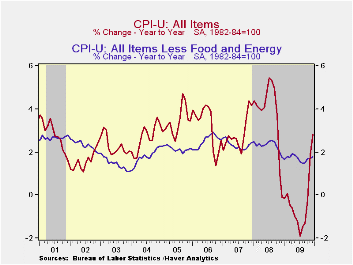
Some said earlier that it wouldn't happen, but last year it did. For all of 2009, consumer prices declined slightly. The 0.3% drop, the first since 1955, was pulled lower by a decline in energy prices. Since the energy price decline, which mostly happened at the end of 2008, prices picked up. December-to-December the CPI rose 2.7% which was the fastest 12-month increase since October 2008. For December alone, the 0.1% CPI rise fell slightly short of expectations but followed stronger gains during the prior four months which were boosted by the rebound in energy prices.
 It was the weak economy, however, that lessened core pricing
power measured either way. For the full year prices less food &
energy rose 1.7% which was the weakest increase since 2003.
December-to-December prices rose a similar 1.8% and that too was the
weakest 12-month gain since 2003. In the latest few months prices
remained weak, up an expected 0.1% in December after no change during
November.
It was the weak economy, however, that lessened core pricing
power measured either way. For the full year prices less food &
energy rose 1.7% which was the weakest increase since 2003.
December-to-December prices rose a similar 1.8% and that too was the
weakest 12-month gain since 2003. In the latest few months prices
remained weak, up an expected 0.1% in December after no change during
November.
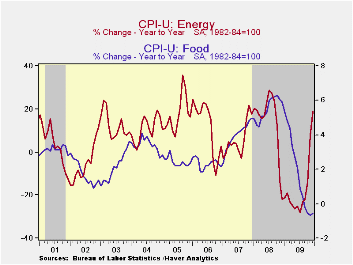
 Energy prices posted just a 0.2% increase
last month but the 19.0% 12-month gain reversed most of the 2008
decline. Gasoline prices rose 0.2%, after a strong 6.4% November rise.
They rose by more than half over twelve months and more-than reversed
the 2008 decline. Fuel oil prices also rose a firm 1.7% (2.5% y/y)
following the 7.3% November gain. This 12-month gain reversed just a
piece of the 13.5% decline during 2008. Finally, prices for natural gas
& electricity slipped 0.1% last month and over twelve months
declined 5.2%.
Energy prices posted just a 0.2% increase
last month but the 19.0% 12-month gain reversed most of the 2008
decline. Gasoline prices rose 0.2%, after a strong 6.4% November rise.
They rose by more than half over twelve months and more-than reversed
the 2008 decline. Fuel oil prices also rose a firm 1.7% (2.5% y/y)
following the 7.3% November gain. This 12-month gain reversed just a
piece of the 13.5% decline during 2008. Finally, prices for natural gas
& electricity slipped 0.1% last month and over twelve months
declined 5.2%.
Food & beverage prices remained weak, up just 0.2% in December. Moreover, the 12-month decline of 0.5% remained near the weakest since 1960. Recent weakness has been led by lower dairy prices (-7.6% y/y) and lower fruit & vegetable (-3.0% y/y) costs. Prices for meats, poultry, fish & eggs also fell 3.8% y/y while cereals & bakery product prices slipped 0.8%. Finally, nonalcoholic beverage prices slipped 0.9% but alcoholic beverage costs rose 1.9% following 4.5% and 3.8% twelve-month gains in the prior two years.
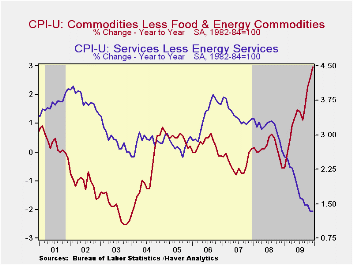
Core goods prices have been comparatively firm, rising 0.2% last month and 3.0% since December 2008. The increase followed little change during the prior several years. Higher tobacco prices continued to account for much of the recent strength with roughly a one-third increase y/y. New & used motor vehicles also firmed considerably. The 0.3% increase last month pulled them up 5.5% since December 2008. That compares with price deflation during the prior two years. Apparel prices also firmed. The 0.4% December increase pulled them up 1.9% since December 2008 following price declines which extend back to 1994. Continuing weak were prices for household furnishings & operation which were unchanged in December. The 1.1% decline since the end of 2008 reversed a 2.0% increase in 2008.
Core services prices
continued weak. 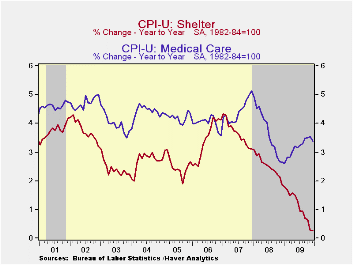 The 0.1% December uptick left them up just 1.3% for the
twelve months which was the weakest increase ever. Weakness in the
housing market continues to accounts for much of that moderation. Last
month, shelter prices were unchanged and rose just 0.3% for the year
after a 2.5% 2008 increase. Owners equivalent rent of primary
residences, a measure not equivalent to other house price measures,
slipped for the fifth month in the last six and rose just 0.7% in 2009
after a 2.1% increase during 2008. Elsewhere in services, public
transportation prices were strong again and posted a 1.4% December
increase which lifted them 3.2% y/y.Medical care services prices
increased 0.2% in December lifting them 3.4% since December 2008.
Finally, education costs remained strong with a 0.4% December increase
that lifted them 4.7% for the whole year after gains in excess of 5%
back to 2000. Recreation prices have really shown the recession's
effect and declined 0.4% in December for the fourth consecutive month
and by 0.4% y/y.
The 0.1% December uptick left them up just 1.3% for the
twelve months which was the weakest increase ever. Weakness in the
housing market continues to accounts for much of that moderation. Last
month, shelter prices were unchanged and rose just 0.3% for the year
after a 2.5% 2008 increase. Owners equivalent rent of primary
residences, a measure not equivalent to other house price measures,
slipped for the fifth month in the last six and rose just 0.7% in 2009
after a 2.1% increase during 2008. Elsewhere in services, public
transportation prices were strong again and posted a 1.4% December
increase which lifted them 3.2% y/y.Medical care services prices
increased 0.2% in December lifting them 3.4% since December 2008.
Finally, education costs remained strong with a 0.4% December increase
that lifted them 4.7% for the whole year after gains in excess of 5%
back to 2000. Recreation prices have really shown the recession's
effect and declined 0.4% in December for the fourth consecutive month
and by 0.4% y/y.
The chained CPI, which adjusts for shifts in consumption patterns, slipped -0.2% last month and rose 2.8% year-to-year. Conversely, chained prices less food and energy fell 0.2% for the second month and the 1.3% full-year increase was the weakest since 2003.
The consumer price data is available in Haver's USECON database while detailed figures can be found in the CPIDATA database.
| Consumer Price Index (%) | December | November | October | Dec. y/y | 2009 | 2008 | 2007 |
|---|---|---|---|---|---|---|---|
| Total | 0.1 | 0.4 | 0.3 | 2.7 | -0.3 | 3.8 | 2.9 |
| Total less Food & Energy | 0.1 | 0.0 | 0.2 | 1.8 | 1.7 | 2.3 | -- |
| Goods less Food & Energy | 0.2 | 0.2 | 0.4 | 3.0 | 1.3 | 0.1 | -0.4 |
| Services less Energy | 0.1 | -0.0 | 0.1 | 1.3 | 1.9 | 3.1 | 3.4 |
| Energy | 0.2 | 4.1 | 1.5 | 19.0 | -18.0 | 13.5 | 5.7 |
| Food & Beverages | 0.2 | 0.1 | 0.1 | -0.4 | 1.9 | 5.4 | 3.9 |
| Chained CPI: Total (NSA) | -0.2 | 0.0 | 0.1 | 2.8 | -0.5 | 3.3 | 2.5 |
| Total less Food & Energy | -0.2 | -0.2 | 0.3 | 1.5 | 1.3 | 1.9 | 1.9 |
by Robert Brusca January 15, 2010
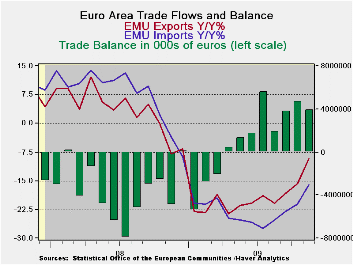
Exports in the Euro-Area faltered and fell in November, dropping for the second month in a row. Even so over three months export growth is at a strong 16.8% pace and is steadily accelerating. Imports are at a three month annual rate of 8.5% and also are accelerating. Despite the relatively better export performance since exports have dropped for two months running there is concern about export prospects. With the drop in exports this month as imports advanced the e-Zone trade surplus naturally receded.
Globally export volume trends are still tuning higher and the pace appears to be accelerating. In the e-Zone Germany’s Yr/Yr export volume performance improved marked between October and November, improving from a Yr/Yr growth rate of -14% to -3%. The UK (an EU country) and Japan also made substantial improvements in that period. US trade made its surge earlier, from August to September.
But for the Zone as a whole exports are not so clearly on better footing even though they are improving on trend. It could be that the Zone countries are simply improving at different speeds and that prevents the overall assessment from improving as rapidly as in the individual large G-10 countries where exports appear to be doing much better.
The trends continue to favor positive appraisals of e-Zone trade but the last two months’ exports have raised some concerns.
| Euro-Area TradeTrends For Goods | |||||
|---|---|---|---|---|---|
| m/m% | % Saar | ||||
| Nov-09 | Oct-09 | 3M | 6M | 12M | |
| Balance* | € 3,926 | € 4,726 | € 4,142 | € 3,610 | € 1,098 |
| Exports | |||||
| All Exp | -0.4% | -0.1% | 16.8% | 10.8% | -9.3% |
| Food and Drinks | -- | -1.8% | -1.9% | -5.9% | -13.4% |
| Raw materials | -- | 4.0% | 29.7% | 17.2% | -6.3% |
| MFG | -- | 1.7% | 24.2% | 6.5% | -16.3% |
| IMPORTS | |||||
| All IMP | 0.3% | -1.0% | 8.5% | 5.7% | -16.1% |
| Food and Drinks | -- | -5.3% | -16.4% | -14.2% | -11.8% |
| Raw materials | -- | 1.5% | 82.1% | 12.9% | -32.9% |
| MFG | -- | -1.6% | -3.0% | -4.6% | -18.2% |
| *Eur mlns; mo or period average; Gray shaded areas lag one month | |||||
by Tom Moeller January 15, 2010
 For
the U.S.
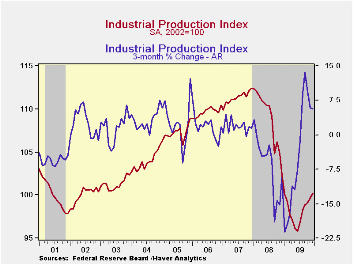
factory sector, 2009 was rough but activity improved as the year went
on. For the year as a whole industrial production fell 9.7% following a
lesser 2008 decline. In June, however, the decline in activity troughed
and since then is up 4.7% helped by an expected 0.6% December increase.
Though the latest gain was all due to a rise in utility output with
arrival of a winter cold snap, factory sector output alone is up 4.6%
from its trough.
For
the U.S.
factory sector, 2009 was rough but activity improved as the year went
on. For the year as a whole industrial production fell 9.7% following a
lesser 2008 decline. In June, however, the decline in activity troughed
and since then is up 4.7% helped by an expected 0.6% December increase.
Though the latest gain was all due to a rise in utility output with
arrival of a winter cold snap, factory sector output alone is up 4.6%
from its trough.
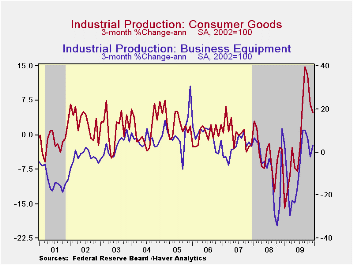
Output of consumer goods rose 0.6% during December. Production here is up 4.8% from its trough due to a one-third rise in auto products output and a 4.4% gain in clothing. Computers, video & audio output lagged with a 2.2% rate of increase during the last six months while output of appliances, furniture & carpeting slipped 0.1%. The latter figure, however, shows some stabilization after an 18.0% full year decline. Business equipment output rose 0.9% last month (-9.6% y/y) and reversed the November decline. Moreover, since the June bottom activity has risen 3.2%.
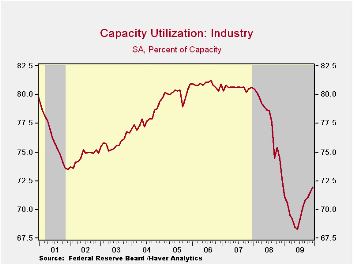
Capacity utilization rose further to 72.0%, its highest level since December 2008 but for the year as a whole the utilization rate dropped to 70.2%. In the factory sector alone utilization held steady m/m at 68.8% but dropped to 67.0% for the year from 75.0% in 2008. Utilization in the primary metals area has risen sharply to 58.9% from a 2009 average of 51.0% with the rebound in output. There's also been rise in utilization in the motor vehicle sector to 52.2% from a low of 36.8% in June but it was 77.0% in 2005. In rise in utilization was accompanied by a 0.1% m/m decline in capacity which was part of a 1.0% December-to-December decline.
The industrial production data are available in Haver's USECON database.
Is the Great Moderation Over? An Empirical Analysis from the Federal Reserve Bank of Kansas City is available here.
| Industrial Production (SA,%) | December | November | October | Y/Y | 2009 | 2008 | 2007 |
|---|---|---|---|---|---|---|---|
| Total Output | 0.6 | 0.6 | 0.2 | -2.1 | -9.7 | -2.2 | 1.5 |
| Manufacturing | 0.0 | 0.9 | -0.2 | -1.9 | -11.2 | -3.2 | 1.4 |
| Consumer Goods | 0.6 | 0.0 | 0.6 | 0.3 | -5.1 | -2.6 | 0.9 |
| Business Equipment | 0.9 | -0.7 | 0.6 | -9.6 | -12.6 | -1.1 | 2.7 |
| Construction Supplies | -2.0 | 1.5 | -1.6 | -10.1 | -17.7 | -6.3 | -2.0 |
| Materials | 0.8 | 1.2 | 0.1 | -0.2 | -10.8 | -1.9 | 2.0 |
| Utilities | 6.0 | -2.4 | 2.6 | -0.8 | -2.6 | 0.3 | 3.4 |
| Capacity Utilization (%) | 72.0 | 71.5 | 71.0 | 72.7 (Dec. '08) | 77.5 | 80.6 |
by Tom Moeller January 15, 2010
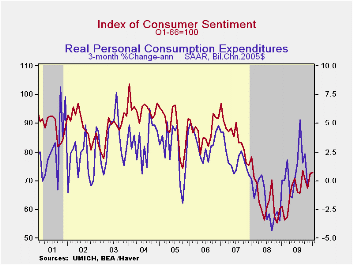 Improvement
in consumer attitudes continues. The Reuters/University of Michigan
Index of Consumer Sentiment for mid-January ticked up to 72.8 from 72.5
last month. Though the latest figure fell short of Consensus
expectations for a reading of 74.0 it was well improved from the low
last fall. During the last ten years there has been a two-thirds
correlation between the level of sentiment and the three-month change
real consumer spending.
Improvement
in consumer attitudes continues. The Reuters/University of Michigan
Index of Consumer Sentiment for mid-January ticked up to 72.8 from 72.5
last month. Though the latest figure fell short of Consensus
expectations for a reading of 74.0 it was well improved from the low
last fall. During the last ten years there has been a two-thirds
correlation between the level of sentiment and the three-month change
real consumer spending.
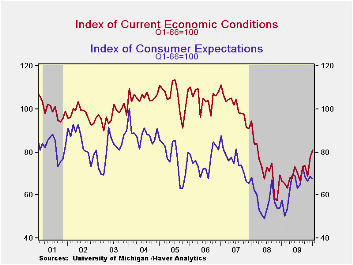
Sentiment about current economic conditions increased another 3.8% after its 13.4% jump from November. The latest was the highest level since March of 2008. Assessments of current financial conditions improved modestly m/m to the highest since September of last year. Buying conditions for large household goods, including furniture, refrigerators, stoves & televisions, also moved up 4.7% to the highest level since January 2008.
The mid-January reading on expected economic conditions fell for the third month in the last four. The 2.0% decline left it down 8.2% from the September high. The outlook for personal finances during the next twelve months fell hard to the lowest level since last March but expectations for business conditions during the year improved and have more-than doubled since last February. Expectations for business conditions during the next five years were unchanged m/m though improved from the 2008 low.
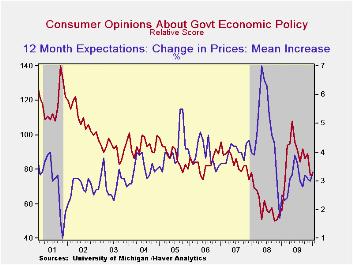
Expected price inflation during the next year rose m/m to 3.3% and it was up from the December 2008 reading of 1.7%. Respondents' view of government policy, which may eventually influence economic expectations, held steady following the sharp December decline. Just twelve percent of respondents thought that a good job was being done by government versus 35% who thought a poor job was being done.
The Reuters/University of Michigan survey data are not seasonally adjusted. The reading is based on telephone interviews with about 500 households at month-end. These mid-month results are based on about 320 interviews. The summary indexes are in Haver's USECON database with details in the proprietary UMSCA database.
Personal Saving and Economic Growth from the Federal Reserve bank of St. Louis is available here here.
| University of Michigan | Mid-January | December | November | Jan y/y | 2009 | 2008 | 2007 |
|---|---|---|---|---|---|---|---|
| Consumer Sentiment | 72.8 | 72.5 | 67.4 | 19.0% | 66.3 | 63.8 | 85.6 |
| Current Conditions | 81.0 | 78.0 | 68.8 | 21.8 | 69.6 | 73.7 | 101.2 |
| Expectations | 67.5 | 68.9 | 66.5 | 16.8 | 64.1 | 57.3 | 75.6 |

Tom Moeller
AuthorMore in Author Profile »Prior to joining Haver Analytics in 2000, Mr. Moeller worked as the Economist at Chancellor Capital Management from 1985 to 1999. There, he developed comprehensive economic forecasts and interpreted economic data for equity and fixed income portfolio managers. Also at Chancellor, Mr. Moeller worked as an equity analyst and was responsible for researching and rating companies in the economically sensitive automobile and housing industries for investment in Chancellor’s equity portfolio. Prior to joining Chancellor, Mr. Moeller was an Economist at Citibank from 1979 to 1984. He also analyzed pricing behavior in the metals industry for the Council on Wage and Price Stability in Washington, D.C. In 1999, Mr. Moeller received the award for most accurate forecast from the Forecasters' Club of New York. From 1990 to 1992 he was President of the New York Association for Business Economists. Mr. Moeller earned an M.B.A. in Finance from Fordham University, where he graduated in 1987. He holds a Bachelor of Arts in Economics from George Washington University.
More Economy in Brief


