 Global| Sep 15 2006
CPI Rose An Expected 0.2%
by:Tom Moeller
|in:Economy in Brief
Summary
In August, the consumer price index (CPI-U) rose an expected 0.2%, half the prior month's gain. Less food & energy, prices also rose an expected 0.2% for the second month and the gain equaled the average rate of increase during 2006. [...]
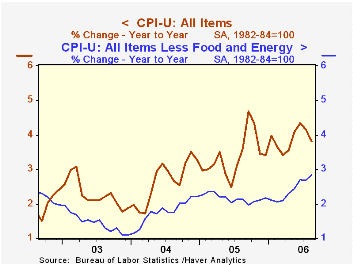
In August, the consumer price index (CPI-U) rose an expected 0.2%, half the prior month's gain. Less food & energy, prices also rose an expected 0.2% for the second month and the gain equaled the average rate of increase during 2006.
Increases in energy prices took a breather last month and rose just 0.2% after the 2.9% July spike. Gasoline prices ticked up just 0.2% (19.6% y/y) to an average $2.95 per gallon but have since declined in September. Last week's read was $2.62 and spot market trading this week suggests further declines in gasoline prices. Natural gas & electricity prices in August rose 0.2% (9.6% y/y) and the spot price for natural gas in September is down roughly 20% m/m.
Core goods prices rose 0.2% after a 0.1% July decline. On average core goods prices have risen 0.1% in 2006. Apparel prices surged 0.9% (0.3% y/y) after declining in July while furniture & bedding prices rose 0.2% (2.0% y/y). Appliance prices declined 0.1% (+0.9% y/y) and new & used motor vehicle prices were unchanged (0.6% y/y). Tobacco prices fell 0.1% (+2.9% y/y) and medical care commodity prices rose 0.3% (3.9% y/y).
Core services prices rose 0.2%, half the gains of the prior three months. Shelter prices rose a diminished 0.2% (3.8% y/y) as the rental equivalence measure of owners' primary residences rose 0.3% (3.9% y/y) and rents rose 0.4% (3.7% y/y) for the third straight month. Public transportation costs increased 0.3% (5.0% y/y) while education costs surged 0.7% (6.4% y/y). Medical care services prices doubled the prior month's rate of increase and rose 0.4% (4.4% y/y).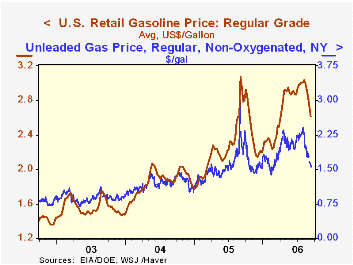
Food & beverage prices rose 0.3% as meat, fish & poultry prices recovered 1.0% (1.5% y/y). Fruit & vegetable prices also surged 1.0% (5.3% y/y) though dairy prices fell 0.8% (-1.6% y/y).
The chained CPI, which adjusts for shifts in the mix of consumer purchases, rose 0.3% while less food & energy prices also rose 0.3%.
U.S. Wage and Price Dynamics: A Limited Information Approach from the Federal Reserve Bank of New York is available here.
Inflation Targets and Inflation Expectations: Some Evidence from the Recent Oil Shocks from the Federal Reserve Bank of San Francisco can be found here.
| Consumer Price Index | August | July | Y/Y | 2005 | 2004 | 2003 |
|---|---|---|---|---|---|---|
| Total | 0.2% | 0.4% | 3.8% | 3.4% | 2.7% | 2.3% |
| Total less Food & Energy | 0.2% | 0.2% | 2.8% | 2.2% | 1.8% | 1.5% |
| Goods less Food & Energy | 0.2% | -0.1% | 0.6% | 0.5% | -0.9% | -2.0% |
| Services less Energy | 0.2% | 0.4% | 3.7% | 2.8% | 2.8% | 2.9% |
| Energy | 0.3% | 2.9% | 15.0% | 16.9% | 10.8% | 12.2% |
| Food & Beverages | 0.3% | 0.2% | 2.5% | 2.4% | 3.4% | 2.1% |
| Chained CPI: Total (NSA) | 0.3% | 0.1% | 3.4% | 2.9% | 2.5% | 2.0% |
| Total less Food & Energy | 0.3% | 0.0% | 2.7% | 1.9% | 1.7% | 1.1% |
by Tom Moeller September 15, 2006
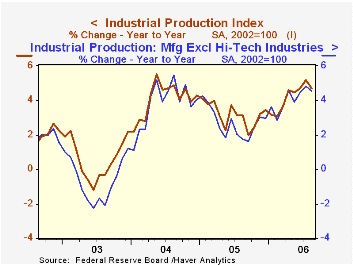
Total U.S. industrial output slipped 0.2% last month and that disappointed Consensus expectations for a 0.2% gain. The decline followed an unrevised 0.4% rise during July.
As hot summer temperatures moderated, utility output reversed nearly all of the July spike with a 0.8% (+0.7% y/y) decline.
Factory sector output also cooled and was unchanged after an upwardly revised 0.3% July increase. So far in 3Q factory output is up at a 3.5% rate versus 2Q which rose 5.1% (AR).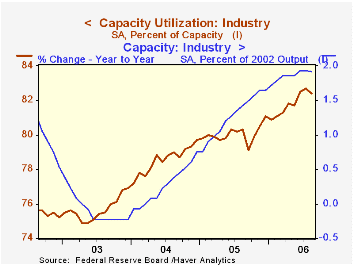
Production of durable consumer goods recovered a piece of the July drop and rose 1.2% (-0.3% y/y) as output of automotive products increased 2.0% (-2.8% y/y) and output of appliances & furniture increased 1.2% (-1.7% y/y) after four straight months of decline. Nondurable consumer goods output fell 0.3% (+2.7% y/y).
Business equipment production slipped 0.2% as output of information processing & equipment fell 0.4% (+17.3% y/y).Factory output overall less the hi-tech industries was unchanged (4.5% y/y).
Overall capacity utilization slipped to 82.4% from an upwardly revised 82.7% in August.
| Production & Capacity | August | July | Y/Y | 2005 | 2004 | 2003 |
|---|---|---|---|---|---|---|
| Industrial Production | -0.2% | 0.4% | 4.7% | 3.2% | 4.1% | 0.6% |
| Manufacturing (NAICS) | 0.0% | 0.3% | 5.6% | 3.9% | 4.8% | 0.5% |
| Consumer Goods | 0.1% | -0.4% | 1.9% | 2.1% | 2.1% | 1.0% |
| Business Equipment | -0.2% | 2.3% | 13.5% | 9.1% | 9.3% | 0.0% |
| Capacity Utilization | 82.4% | 82.7% | 80.3% (8/05) | 80.1% | 78.6% | 75.7% |
by Tom Moeller September 15, 2006
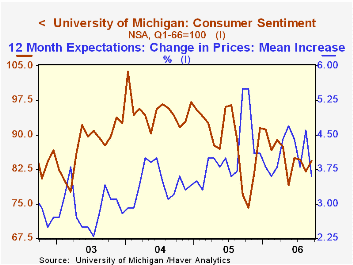
Consumer sentiment in early September added to the gains of late August, according to the University of Michigan. The mid-month reading rose 2.9% to 84.4 on top of the late-August rise which limited that month's decline to 3.2%. Consensus expectations for an increase to 84.0.
During the last ten years there has been a 77% correlation between the level of consumer sentiment and the y/y change in real consumer spending and during those ten years sentiment has a 68% correlation with the change in nonfarm payrolls.
Expectations for the economy surged 13.4% m/m to the highest level since January. Expected business conditions next year and over the next five years improved sharply. The expected change in personal finances, however, improved just moderately. 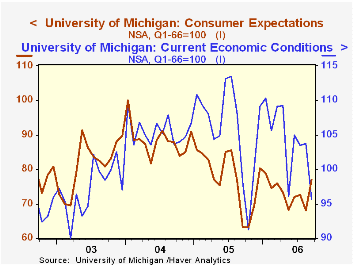
The reading of current economic conditions fell sharply m/m to the lowest level since last October. The current read of personal finances and perceived buying conditions for large household goods both fell.
Consumers' opinion about gov't economic policy was unchanged for the third month (0.0% y/y). Expected inflation during the next year fell sharply to 3.6%, its lowest level since February. The five to ten year expected rate of inflation also fell to 3.2%, reversing all of the rise during August.
The University of Michigan survey is not seasonally adjusted.The mid-month survey is based on telephone interviews with 250 households nationwide on personal finances and business and buying conditions. The survey is expanded to a total of 500 interviews at month end.
| University of Michigan | Sept. (Prelim.) | August | Y/Y | 2005 | 2004 | 2003 |
|---|---|---|---|---|---|---|
| Consumer Sentiment | 84.4 | 82.0 | 9.8% | 88.6 | 95.2 | 87.6 |
| Current Conditions | 95.7 | 103.8 | -2.4% | 105.9 | 105.6 | 97.2 |
| Expectations | 77.1 | 68.0 | 21.8% | 77.4 | 88.5 | 81.4 |
by Carol Stone September 15, 2006
Earlier this week, Louise Curley highlighted the fragility of recent gains in the Japanese economy. She described new weakness in manufacturing orders and some deterioration in consumer confidence. Today, data on flow of funds in the financial system for Q2 2006 add more to the ambiguity about the outlook. For instance, the move by the Bank of Japan away from its zero-interest-rate monetary policy in mid-July was based partly on renewed growth in bank lending. This continues, but other liabilities in the domestic economy have started to weaken again.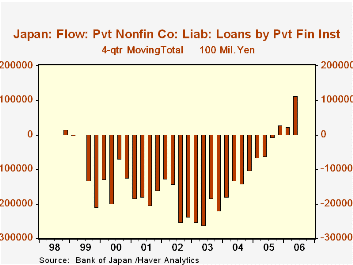
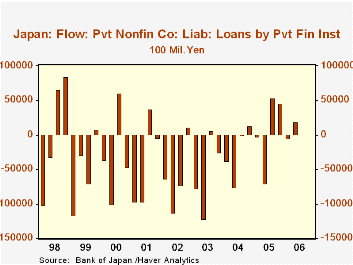
The Japanese flow of funds data are not seasonally adjusted, and Q2 is a generally a period of contraction in credit as an old fiscal year has just been closed out and a new one begun. So negative reports for this period are unremarkable in and of themselves. In fact, a striking aspect of these new flow-of-funds data is a quarterly increase in lending to private corporations; at +¥1.89 trillion, it's not large, but it's the first Q2 increase in the nine years history of this style of Flow of Funds accounts. Q3 and Q4 often see sizable increases in credit transactions. So a 4-quarter total might give us a good idea of the overall strength of lending; indeed, there has been a dramatic upturn in financial institution lending to business on this basis, which reached +¥11.35 trillion through Q2, compared to a contraction of ¥6.02 trillion in Q2 2005 and progressively larger declines going back to early 2003.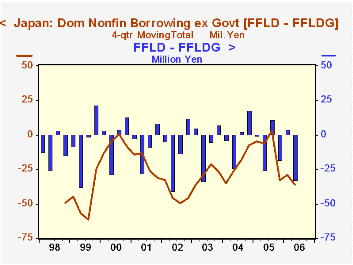
But other private-sector uses of credit remain sluggish or erratic. Total liabilities of the domestic nonfinancial sector excluding government fell ¥32.52 trillion in Q2, yielding a 4-quarter total of -¥35.82 trillion -- that is, net paydowns -- actually much worse than the -¥5.97 trillion of a year ago. Even total private corporation borrowing was weaker in Q2 2006, -¥21.81 trillion, than in Q2 2005, -¥18.05 trillion, although the 4-quarter total was positive.
Households have the same pattern, a drop in Q2 2006 that is larger than Q2 2005, but an outright increase in the more recent 4-quarter total contrasting with the liquidation in the year-ago period.
So credit data, as well as real-sector business and consumer indicators, suggest that the economic gains we were all so pleased about earlier this year in Japan are hardly on sure footing.
| Japan: Flow of Funds, Tril.¥ | 2Q 2006 | 1Q 2006 | 2Q 2005 | 2005 | 2004 | 2003 |
|---|---|---|---|---|---|---|
| Total Liabilities, Domestic Nonfin Sector ex Govt | -32.52 | +37.12 | -25.57 | -- | -- | -- |
| 4-Qtr Total | -35.82 | -28.87 | -5.97 | +46.83 | +53.10 | +25.59 |
| Private Nonfin Corporations | -21.81 | -1.17 | -18.05 | -- | -- | -- |
| 4-Qtr Total | +7.37 | +11.14 | -6.07 | +6.17 | +2.04 | -23.14 |
| Loans | +1.89 | -0.48 | -7.00 | -- | -- | -- |
| 4-Qtr Total | +11.35 | +2.45 | -6.02 | +2.70 | -10.14 | -21.84 |
| Households | -11.43 | +7.45 | -7.56 | -- | -- | -- |
| 4-Qtr Total | +4.09 | +7.96 | -1.30 | +4.74 | -4.36 | -1.24 |

Tom Moeller
AuthorMore in Author Profile »Prior to joining Haver Analytics in 2000, Mr. Moeller worked as the Economist at Chancellor Capital Management from 1985 to 1999. There, he developed comprehensive economic forecasts and interpreted economic data for equity and fixed income portfolio managers. Also at Chancellor, Mr. Moeller worked as an equity analyst and was responsible for researching and rating companies in the economically sensitive automobile and housing industries for investment in Chancellor’s equity portfolio. Prior to joining Chancellor, Mr. Moeller was an Economist at Citibank from 1979 to 1984. He also analyzed pricing behavior in the metals industry for the Council on Wage and Price Stability in Washington, D.C. In 1999, Mr. Moeller received the award for most accurate forecast from the Forecasters' Club of New York. From 1990 to 1992 he was President of the New York Association for Business Economists. Mr. Moeller earned an M.B.A. in Finance from Fordham University, where he graduated in 1987. He holds a Bachelor of Arts in Economics from George Washington University.
More Economy in Brief


