 Global| Sep 15 2005
CPI Lifted By Strong Energy Prices
by:Tom Moeller
|in:Economy in Brief
Summary
Consumer prices (CPI-U) rose an expected 0.5% last month, the same as the unrevised increase in July. The gain in prices less food & energy prices also has been stable, the same 0.1% for four months. Consensus expectations had been [...]
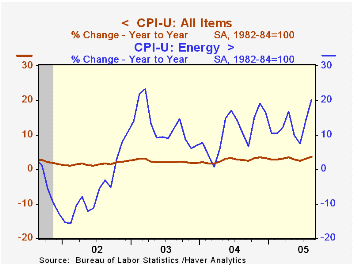
Consumer prices (CPI-U) rose an expected 0.5% last month, the same as the unrevised increase in July. The gain in prices less food & energy prices also has been stable, the same 0.1% for four months. Consensus expectations had been for a 0.2% increase.
Energy prices added to the prior month's strength and jumped 5.0% led by an 8.3% (31.4% y/y) rise in gasoline prices to an average $2.49 per gallon. In August gasoline prices have risen further to over $3.00 per gallon. Fuel oil prices also rose a strong 2.9% (33.2% y/y increase and natural gas prices rose 1.3% (7.7% y/y).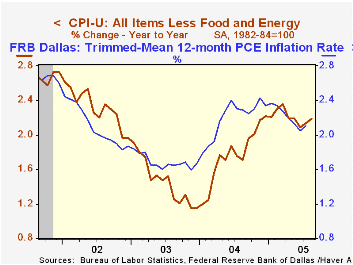
Core goods prices rose 0.1%. This second increase in seven months was led by a 1.0% (-1.6% y/y) rise in apparel prices and a 1.3% (0.2% y/y) gain in audio & equipment. Tobacco prices also rose 0.6% (5.2% y/y). New vehicle prices, down 0.5% (+0.1% y/y), fell hard for the second consecutive month and furniture & bedding prices fell 0.5%(-1.2% y/y).
Core services prices rose a modest 0.1% as shelter prices were unchanged (+2.5% y/y) and as medical care services prices fell slightly (4.5% y/y). Public transportation prices rose just 0.1% (6.5% y/y) and school tuition costs rose 0.2% (6.3% y/y).
The chained CPI which adjusts for shifts in the mix of consumer purchases rose 0.4% and less food & energy chain prices rose 0.2%.
Trimmed Mean PCE Inflation from the Federal Reserve Bank of Dallas can be found here.
Reading Inflation Expectations from CPI Futures from the Federal Reserve Bank of St. Louis is available here.
| Consumer Price Index | Aug | July | Y/Y | 2004 | 2003 | 2002 |
|---|---|---|---|---|---|---|
| Total | 0.5% | 0.5% | 3.6% | 2.7% | 2.3% | 1.6% |
| Total less Food & Energy | 0.1% | 0.1% | 2.2% | 1.8% | 1.5% | 2.3% |
| Goods less Food & Energy | 0.1% | -0.3% | 0.7% | -0.9% | -2.0% | -1.1% |
| Services less Energy | 0.1% | 0.3% | 2.7% | 2.8% | 2.9% | 3.8% |
| Energy | 5.0% | 3.8% | 20.3% | 10.9% | 12.2% | -5.9% |
| Food | 0.0% | 0.2% | 2.2% | 3.4% | 2.1% | 1.8% |
| Chained CPI: Total (NSA) | 0.4% | 0.4% | 3.0% | 2.3% | 2.0% | 1.3% |
| Total less Food & Energy | 0.2% | 0.0% | 1.8% | 1.5% | 1.1% | 1.9% |
by Tom Moeller September 15, 2005
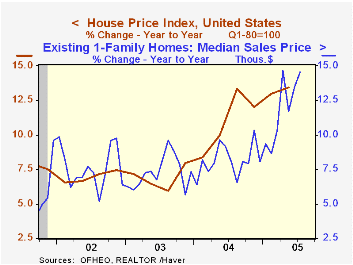
Home prices as tallied by the Office of Federal Housing Enterprise Oversight (OFHEO) surged 3.2% last quarter. The gain represented a some strengthening of the pattern of double digit annualized gains in home prices which began in late 2003.
The OFHEO house price index is a geometric weighted average based on more than 26.5 million repeat transactions (purchase or refinance) over 29 years and 12,000 transactions annually.
Year to year, the 28.1% rise in house prices in Nevada ranked highest followed by 27.8% appreciation in Arizona and 25.9% in Hawaii.
The slowest rates of house price appreciation were logged in Ohio (4.8%, Indiana (4.7%) and Texas (4.7%).
View the latest OFHEO release here.
Are Home Prices the Next "Bubble"? from the Federal Reserve Bank of New York can be found here.
| OFHEO | 2Q05 | 1Q05 | Y/Y | 2004 | 2003 | 2002 |
|---|---|---|---|---|---|---|
| House Price Index | 3.2% | 2.6% | 13.4% | 11.0% | 6.9% | 7.0% |
by Tom Moeller September 15, 2005
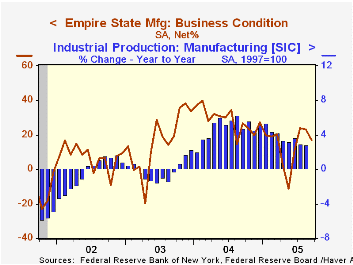
The September Empire State Index of General Business Conditions in New York's manufacturing industries dipped to 16.97 from 23.04 in August.
The new orders component fell sharply following its earlier improvement to 13.10 but the shipments index rose to the highest level since February. The employment index also rose to its highest since January while the prices paid index surged.
Like the Philadelphia Fed Index of General Business Conditions, the Empire State Business Conditions Index reflects answers to an independent survey question; it is not a weighted combination of the components. 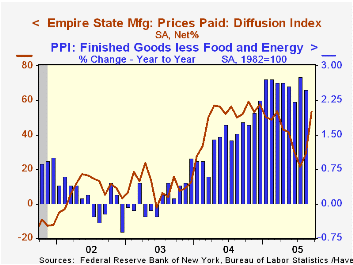
The index of expectations for business conditions in six months fell sharply although expectations for future capital spending rose.
The Empire State Manufacturing Survey is a monthly survey of manufacturers in New York State conducted by the Federal Reserve Bank of New York. Participants from across the state in a variety of industries respond to a questionnaire and report the change in a variety of indicators from the previous month. Respondents also state the likely direction of these same indicators six months ahead. April 2002 is the first report, although survey data date back to July 2001.
For more on the Empire State Manufacturing Survey, including methodologies and the latest report, click here.
| Empire State Manufacturing Survey | Sept | Aug | Sept '04 | 2004 | 2003 | 2002 |
|---|---|---|---|---|---|---|
| General Business Conditions (diffusion index) | 16.97 | 23.04 | 26.72 | 28.76 | 16.17 | 7.19 |
by Tom Moeller September 15, 2005
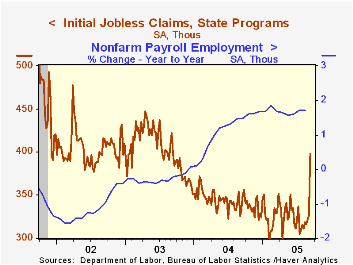
Initial claims for unemployment insurance surged 71,000 to 398,000 from the prior week. Consensus expectations had been for a rise to 345,000.
The Labor Department indicated that at least 68,000 of the new claims were directly related to Hurricane Katrina and that number will most likely be revised upward next week as state workers make their way to distant relief shelters.
The four-week moving average of initial claims rose to 340,750 (0.6% y/y).
Continuing claims for unemployment insurance rose 20,000 following a deepened 28,000 decline the week prior.
The insured unemployment rate remained at its four-year low of 2.0% for the ninth consecutive week.
The Recession of 2001 and Unemployment Insurance Financing from the Federal Reserve Bank of New York is available here.
| Unemployment Insurance (000s) | 09/10/05 | 09/03/05 | Y/Y | 2004 | 2003 | 2002 |
|---|---|---|---|---|---|---|
| Initial Claims | 398 | 327 | 19.5% | 343 | 402 | 404 |
| Continuing Claims | -- | 2,590 | -9.3% | 2,926 | 3,531 | 3,570 |
by Carol Stone September 15, 2005
China's National Bureau of Statistics published energy production data today for August. Their statisticians convert various forms of energy to a coal-equivalent volume. In August, total energy output amounted to 154.28 million tonnes of "standard coal", up 14.1% from a year ago. Several factors are notable about the role of energy in China.
China uses much more coal than oil. Data for the year 2004 show coal accounting for 67.7% of energy consumption, compared with crude oil at just 22.7%. In the US, by contrast, where comparative energy statistics are expressed in quadrillion BTUs, coal accounted for 22.3% last year and oil, 40.5%. Natural gas, used just marginally in China, with 2.6% of consumption, is a major source in the US, providing 23.1% of energy.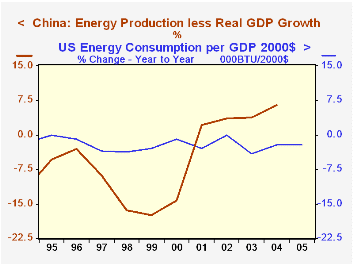
Another notable difference with the US is in energy efficiency. In the US, the number of BTU needed to produce a dollar of GDP (in real terms) has fallen steadily since the early 1970s (see second graph), while in China, the opposite trend applies. GDP growth in 2003 and 2004 was 9.5%, but energy production increased by 13.3% in 2003 and 15.9% last year. Some moderation is seen in the latest couple of months, but August's 14.1% expansion is surely still much stronger than GDP growth. A fast glance at various other measures of Chinese economic activity suggests that process of development is possibly the origin of this movement, not that Chinese people and businesses are becoming more profligate energy users. Automobile sales are rising rapidly as is business investment. Construction of infrastructure and heavy manufacturing activity take considerable power.
So it is not just China's rapid growth that is adding to world demand for energy, but the more intense use of energy in the modern Chinese economy.
| Aug 2005 | July 2005 | June 2005 | 2004 | 2003 | 2002 | |
|---|---|---|---|---|---|---|
| Energy Production (Mil Ton SCE*) |
Annual Total | |||||
| 1556.0 | 1342.0 | 1184.2 | ||||
| 154.28 | 152.91 | 156.58 | Monthly Average | |||
| 129.66 | 111.83 | 98.68 | ||||
| Yr/Yr % Change | 14.1% | 14.8% | 15.9% | 15.9% | 13.3% | 11.9% |
| Coal Production (Mil Ton) | 153.96 | 151.76 | 158.60 | 130.43 | 109.60 | 92.34 |
| Yr/Yr % Change | 16.2% | 15.4% | 17.1% | 19.0% | 18.7% | 15.4% |
| Refined Crude Oil | 24.23 | 24.62 | 23.80 | 22.88 | 20.15 | 18.28 |
| Yr/Yr % Change | 3.2% | 7.4% | 5.8% | 13.5% | 10.2% | 4.2% |

Tom Moeller
AuthorMore in Author Profile »Prior to joining Haver Analytics in 2000, Mr. Moeller worked as the Economist at Chancellor Capital Management from 1985 to 1999. There, he developed comprehensive economic forecasts and interpreted economic data for equity and fixed income portfolio managers. Also at Chancellor, Mr. Moeller worked as an equity analyst and was responsible for researching and rating companies in the economically sensitive automobile and housing industries for investment in Chancellor’s equity portfolio. Prior to joining Chancellor, Mr. Moeller was an Economist at Citibank from 1979 to 1984. He also analyzed pricing behavior in the metals industry for the Council on Wage and Price Stability in Washington, D.C. In 1999, Mr. Moeller received the award for most accurate forecast from the Forecasters' Club of New York. From 1990 to 1992 he was President of the New York Association for Business Economists. Mr. Moeller earned an M.B.A. in Finance from Fordham University, where he graduated in 1987. He holds a Bachelor of Arts in Economics from George Washington University.
More Economy in Brief


