 Global| Aug 16 2005
CPI Lifted By Strong Energy Prices
by:Tom Moeller
|in:Economy in Brief
Summary
Consumer prices (CPI-U) rose 0.5% last month following no change in June and a 0.1% decline in May. Consensus expectations had been for a 0.4% July increase. Energy prices jumped 3.8% led by a 6.1% (19.5% y/y) increase in gasoline [...]
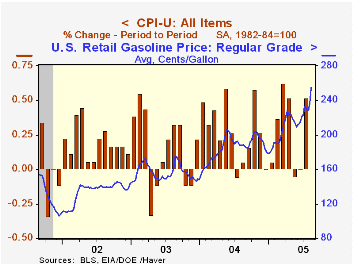
Consumer prices (CPI-U) rose 0.5% last month following no change in June and a 0.1% decline in May. Consensus expectations had been for a 0.4% July increase.
Energy prices jumped 3.8% led by a 6.1% (19.5% y/y) increase in gasoline prices to an average $2.29 per gallon. In August gasoline prices have risen further to $2.55 per gallon. Fuel oil prices also posted a strong 6.2% (34.3% y/y increase while natural gas prices gained 1.1% (7.1% y/y) and have strengthened further this month..
Less food & energy prices rose 0.1% for the third consecutive month. Consensus expectations had been for a 0.2% increase.
Core goods prices, down 0.3%, fell for the third month in the last four led by a 1.0% (+0.3% y/y) decline in new vehicle prices. Appliance prices fell 0.5% (+2.0% y/y) and apparel prices tumbled 0.9% (-1.9% y/y), down hard for the third month in the last four.
Core services prices rose 0.3% as medical care services prices doubled the gain in June with a 0.4% (4.8% y/y) increase. Public transportation prices jumped 1.0% (5.5% y/y) and school tuition costs gained 0.6% (6.6% y/y). Shelter prices rose 0.3% (2.5% y/y).
The chained CPI which adjusts for shifts in the mix of consumer purchases rose 0.4% but less food & energy chain prices were unchanged.
| Consumer Price Index | July | June | Y/Y | 2004 | 2003 | 2002 |
|---|---|---|---|---|---|---|
| Total | 0.5% | 0.0% | 3.1% | 2.7% | 2.3% | 1.6% |
| Total less Food & Energy | 0.1% | 0.1% | 2.1% | 1.8% | 1.5% | 2.3% |
| Goods less Food & Energy | -0.3% | -0.2% | 0.4% | -0.9% | -2.0% | -1.1% |
| Services less Energy | 0.3% | 0.2% | 2.8% | 2.8% | 2.9% | 3.8% |
| Energy | 3.8% | -0.5% | 14.2% | 10.9% | 12.2% | -5.9% |
| Food | 0.2% | 0.1% | 2.2% | 3.4% | 2.1% | 1.8% |
| Chained CPI: Total (NSA) | 0.4% | -0.1% | 2.6% | 2.3% | 2.0% | 1.3% |
| Total less Food & Energy | 0.0% | -0.2% | 1.8% | 1.5% | 1.1% | 1.9% |
by Tom Moeller August 16, 2005
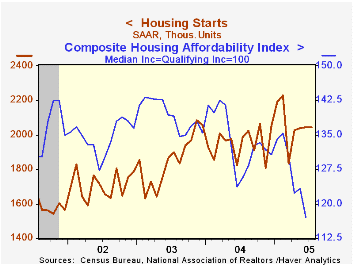
Housing starts remained firm last month at 2.042M units versus an upwardly revised 2.045M units in June.Consensus expectations had been for a slight decline to 2.025M starts.
Single-family starts nudged up 0.5% after a 1.2% decline in June. Single family starts in the Midwest rose 5.0% (0.6% y/y) and in the West rose 4.1% (-7.4% y/y). Single family starts in the Northeast starts fell 7.6% (+12.6% y/y) and in the South starts fell 1.5% (+9.0% y/y).
Multi family starts gave back half of the prior month's rise and fell 3.2%.
Building permits increased for the second consecutive month and rose 1.6%.
| Housing Starts (000s, AR) | July | June | Y/Y | 2004 | 2003 | 2002 |
|---|---|---|---|---|---|---|
| Total | 2,042 | 2,045 | 2.8% | 1,950 | 1,854 | 1,7 10 |
| Single-family | 1,711 | 1,703 | 3.0% | 1,604 | 1,505 | 1,363 |
| Multi-family | 331 | 342 | 1.8% | 345 | 349 | 347 |
| Building Permits | 2,167 | 2,132 | 2.5% | 2,058 | 1,8 88 | 1,749 |
by Tom Moeller August 16, 2005
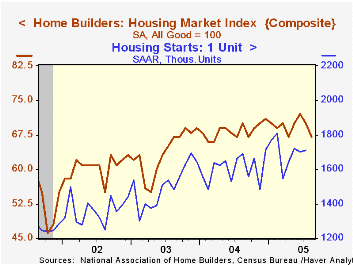
The National Association of Home Builders' (NAHB) Composite Housing Market Index fell sharply in August to 67 from an unrevised 70 In July.
During the last twenty years, annual changes in the composite index had an 85% correlation with the change in single family housing starts.
The August index for current sales of single family homes fell for the second consecutive month (-5.3%% y/y) but the index of expected sales in six months was stable (-1.3% y/y).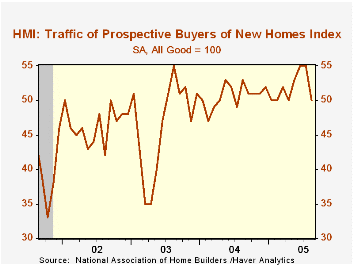
Traffic of prospective home buyers fell from July's record high.
The NAHB index is a diffusion index based on a survey of builders. Readings above 50 signal that more builders view conditions as good than poor.
Visit the National Association of Home Builders.
| Nat'l Association of Home Builders | August | July | August '04 | 2004 | 2003 | 2002 |
|---|---|---|---|---|---|---|
| Composite Housing Market Index | 67 | 70 | 70 | 68 | 64 | 61 |
by Tom Moeller August 16, 2005
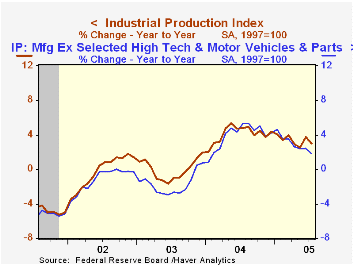
Industrial production increased 0.1% last month following a downwardly revised 0.8% gain in June. Consensus expectations had been for a 0.5% rise. Factory sector output also slowed to half the prior month's gain and rose 0.2% (3.1% y/y) in July.
Lower motor vehicle production, off 2.3% (+4.4% y/y), was responsible for much of last month's weakness in output growth. Less motor vehicles, factory output rose 0.3% (2.8% y/y) after a 0.2% June increase.
With a 2.6% (19.0% y/y) spike, output of computers & peripheral equipment posted the largest one month increase since January. Excluding the high tech sector as well as autos, factory output rose 0.2% (1.8% y/y).
Output of industrial & other equipment jumped 1.3% (1.8% y/y) and furniture output rose 0.4% (-1.9% y/y). On the weak side was nondurable goods which fell 0.2% (+1.2% y/y).
Total capacity utilization dipped to 79.7% and capacity grew 1.1% y/y. Factory sector utilization was stable at 78.3%, up from 77.0% last July and capacity rose 1.3% y/y.
The Relationship Between Capacity Utilization and Inflation from the Federal Reserve Bank of Philadelphia can be found here.
| Production & Capacity | July | June | Y/Y | 2004 | 2003 | 2002 |
|---|---|---|---|---|---|---|
| Industrial Production | 0.1% | 0.8% | 3.0% | 4.1% | -0.0% | -0.3% |
| Consumer Goods | -0.4% | 1.1% | 3.0% | 2.7% | 0.3% | 1.4% |
| Business Equipment | 1.2% | 0.2% | 6.7% | 9.5% | 1.2% | -7.9% |
| Capacity Utilization | 79.7% | 79.8% | 78.3% (7/04) | 78.1% | 75.5% | 75.3% |
by Tom Moeller August 16, 2005
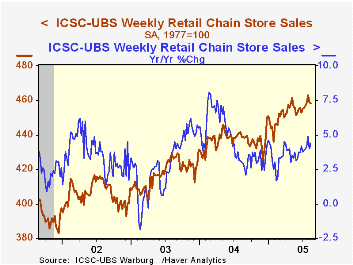
Chain store sales dipped for the second week according to the International Council of Shopping Centers (ICSC)-UBS survey. A 0.2% w/w decline followed a 0.8% fall during the opening week of August. Sales so far this month are 0.2% ahead of the July average which rose 0.8% from June.
During the last ten years there has been a 56% correlation between the y/y change in chain store sales and the change in non-auto retail sales less gasoline, as published by the US Census Department. Chain store sales correspond directly with roughly 14% of non-auto retail sales less gasoline.
The leading indicator of chain store sales from ICSC recouped about half of the prior week's decline with a 0.4% (-0.3% y/y) rise.
The ICSC-UBS retail chain-store sales index is constructed using the same-store sales (stores open for one year) reported by 78 stores of seven retailers: Dayton Hudson, Federated, Kmart, May, J.C. Penney, Sears and Wal-Mart.
| ICSC-UBS (SA, 1977=100) | 08/13/05 | 08/06/05 | Y/Y | 2004 | 2003 | 2002 |
|---|---|---|---|---|---|---|
| Total Weekly Chain Store Sales | 458.0 | 458.9 | 4.4% | 4.6% | 2.9% | 3.6% |
by Louise Curley August 16, 2005
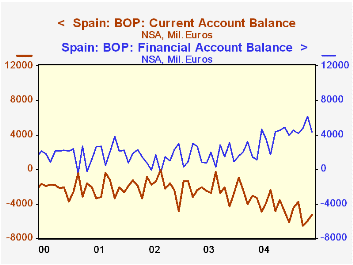
Spain reported balance of payment data for May today. Spain's presentation of balance of payments data differs from that of most other countries. Included in the financial account is the category, "Bank of Spain." This item includes the change in international reserves, which in most presentations is a separate item, in addition to international transactions of the Bank of Spain. As a result the balance on Spain's current account is completely offset by the sum of the capital account, the financial account and the residual item, "errors and omissions." The first chart shows the current account and the financial account balances.
Over the past year and a half, the current account deficit has become increasingly more negative, while the financial account has become more positive. As most developed countries have abandoned capital controls over the international flow of funds, it has become more difficult to decide whether it is the current account or the financial account that calls the tune in the eventual balancing of the accounts. Before the relaxation of capital controls, it was generally agreed that the driving force in a country's balance of payments was its balance on current account. Now, however, it is agreed that capital flows are an additional factor, or in some cases, the major factor in determining the eventual balance of the accounts.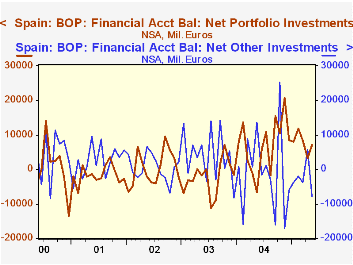
The elements of the current account, exports and imports goods, services and the balance of wages and income from foreign activities tend to show rather smooth trends. The elements of the financial account, however, exhibit very volatile trends. For example, there was a net outflow of "other investment," in May of 7,834 million euros after an inflow of 5,657 million euros in April, resulting in an negative change of 13,491 million euros between April and May. Direct and portfolio investment, derivatives and financial flows of the Bank of Spain, however, all contributed to an almost equal positive change. The volatility and the diverse movements of the various capital flows are illustrated in the second chart that shows net portfolio and net "other" investments in Spain's balance of payments.
| Spain: Balance of Payments (Mil. Euros) |
May 05 | Apr 05 | May 04 | M/M Dif | Y/Y Dif | 2004 | 2003 | 2002 |
|---|---|---|---|---|---|---|---|---|
| Current Account | -5258 | -6014 | -3314 | 756 | -1944 | -44450 | -27908 | -23812 |
| Capital Account | 990 | 308 | 1867 | 682 | -877 | 8547 | 8165 | 7663 |
| Financial Account | 4347 | 6183 | 1104 | -1836 | 3243 | 36836 | 18875 | 15988 |
| Net Direct Investment | 247 | -902 | 46 | 1149 | 201 | -26345 | -1418 | 6904 |
| Net Portfolio Investment | 7086 | 3231 | -6650 | 3855 | 13736 | 85804 | -26592 | 4727 |
| Net Other Investment | -7834 | 5657 | 13610 | -13491 | -21446 | -9776 | 48750 | 5712 |
| Derivatives | -123 | -1036 | 308 | 913 | -431 | 1162 | -3434 | -4915 |
| Bank of Spain | 4970 | -767 | -6209 | 5737 | 11179 | -14010 | 1576 | 3561 |
| Errors and Omissions | -79 | -478 | 343 | 399 | -422 | 36836 | 18875 | 15988 |

Tom Moeller
AuthorMore in Author Profile »Prior to joining Haver Analytics in 2000, Mr. Moeller worked as the Economist at Chancellor Capital Management from 1985 to 1999. There, he developed comprehensive economic forecasts and interpreted economic data for equity and fixed income portfolio managers. Also at Chancellor, Mr. Moeller worked as an equity analyst and was responsible for researching and rating companies in the economically sensitive automobile and housing industries for investment in Chancellor’s equity portfolio. Prior to joining Chancellor, Mr. Moeller was an Economist at Citibank from 1979 to 1984. He also analyzed pricing behavior in the metals industry for the Council on Wage and Price Stability in Washington, D.C. In 1999, Mr. Moeller received the award for most accurate forecast from the Forecasters' Club of New York. From 1990 to 1992 he was President of the New York Association for Business Economists. Mr. Moeller earned an M.B.A. in Finance from Fordham University, where he graduated in 1987. He holds a Bachelor of Arts in Economics from George Washington University.
More Economy in Brief


