 Global| Feb 22 2006
CPI Lifted By Energy & Food
by:Tom Moeller
|in:Economy in Brief
Summary
The 0.7% gain in the January consumer price index (CPI-U) was the strongest for any month since last September and lifted the y/y gain to a firm 4.0%. Consensus expectations had been for a 0.5% m/m rise. Energy prices ballooned 5.0% [...]

The 0.7% gain in the January consumer price index (CPI-U) was the strongest for any month since last September and lifted the y/y gain to a firm 4.0%. Consensus expectations had been for a 0.5% m/m rise.
Energy prices ballooned 5.0% as gasoline prices rose 6.4% (27.4% y/y) and electricity prices surged 5.5% (15.1% y/y). The price charged by utilities for natural gas (34.5% y/y) also rose but both in January & February the spot market price for gas fell sharply. The average retail price paid for gasolinealso fell in February to $2.29 per gallon from $2.32 during January.
The 0.5% jump in food prices was the strongest for any month since last April and reflected a 1.7% (6.3% y/y) surge in fruits & vegetables as well as 0.5% increases in the prices of cereals (1.4% y/y) and dairy products (0.3% y/y).
Prices less food & energy rose a moderate 0.2% and matched Consensus expectations. Prices for core goods and for core services both rose 0.2%.
Apparel prices (-1.0% y/y) recovered 0.3% after a like decline during December and new vehicle prices rose 0.6% (-0.4% y/y) after two down months. Furniture & bedding prices (0.4% y/y) fell slightly as did appliance prices (+1.9% y/y). Medical care commodity prices doubled the December increase and rose 0.4% (3.8% y/y).
The 0.2% increase in core services prices was held back by an unchanged level of medical care services prices (4.1% y/y) but school tuition & fees jumped 0.7% (6.4% y/y). Shelter prices inched up 0.1% (2.5% y/y) while public transportation prices surged 1.3% (7.5% y/y).
The chained CPI which adjusts for shifts in the mix of consumer purchases jumped 0.7%. Less food & energy prices rose a moderate 0.3%.
The minutes of the latest meeting of the Federal Open Market Committee can be found here.
| Consumer Price Index | Jan | Dec | Y/Y | 2005 | 2004 | 2003 |
|---|---|---|---|---|---|---|
| Total | 0.7% | -0.1% | 4.0% | 3.4% | 2.7% | 2.3% |
| Total less Food & Energy | 0.2% | 0.1% | 2.1% | 2.2% | 1.8% | 1.5% |
| Goods less Food & Energy | 0.2% | 0.0% | 0.1% | 0.5% | -0.9% | -2.0% |
| Services less Energy | 0.2% | 0.3% | 2.9% | 2.8% | 2.8% | 2.9% |
| Energy | 5.0% | -2.1% | 24.7% | 16.9% | 10.9% | 12.2% |
| Food | 0.5% | 0.1% | 2.7% | 2.4% | 3.4% | 2.1% |
| Chained CPI: Total (NSA) | 0.7% | -0.3% | 3.4% | 2.9% | 2.5% | 2.0% |
| Total less Food & Energy | 0.3% | -0.1% | 1.8% | 1.9% | 1.7% | 1.1% |
by Tom Moeller February 22, 2006
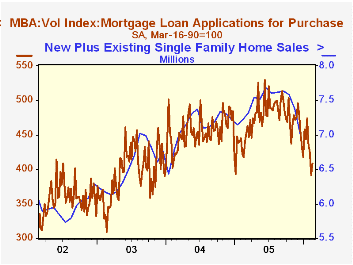
The total number of mortgage applications inched 0.8% last week after three consecutive weeks of sharp decline. The average level of applications this month is down 5.6% from January.
Purchase applications recovered 4.3% following three weeks of sharp decline. The average level of purchase applications in February is down 9,8% from the January average.
During the last ten years there has been a 50% correlation between the y/y change in purchase applications and the change in new plus existing single family home sales.
Moving in the other direction last week, applications to refinance fell 4.0% w/w and this month's average is off 0.8% from January.
The effective interest rate on a conventional 30-year mortgage dipped to 6.47% versus an average 6.34% in January. The effective rate on a 15-year mortgage also dipped to 6.18% versus an average 5.98% last month. Interest rates on 15 and 30 year mortgages are closely correlated (>90%) with the rate on 10 year Treasury securities and during the last ten years there has been a (negative) 82% correlation between purchase applications and the effective rate on a 30-Year mortgage.
The Mortgage Bankers Association surveys between 20 to 35 of the top lenders in the U.S. housing industry to derive its refinance, purchase and market indexes. The weekly survey accounts for more than 40% of all applications processed each week by mortgage lenders. Visit the Mortgage Bankers Association site here.
| MBA Mortgage Applications (3/16/90=100) | 02/17/06 | 02/10/06 | Y/Y | 2005 | 2004 | 2003 |
|---|---|---|---|---|---|---|
| Total Market Index | 578.5 | 574.1 | -20.5% | 708.6 | 735.1 | 1,067.9 |
| Purchase | 408.7 | 391.7 | -2.2% | 470.9 | 454.5 | 395.1 |
| Refinancing | 1,571.4 | 1,636.7 | -37.9% | 2,092.3 | 2,366.8 | 4,981.8 |
by Tom Moeller February 22, 2006

Chain store sales last week recovered half of the prior period's drop with a 0.2% advance, according to the International Council of Shopping Centers (ICSC)-UBS survey.
Because a sharp 2.0% jump during the opening week of the month, sales so far in February are 0.7% ahead of the January average which rose 1.0% from December.
The leading indicator of chain store sales fell for the third consecutive week and the 0.4% w/w decline lowered the February level 1.6% below the January average.The ICSC-UBS retail chain-store sales index is constructed using the same-store sales (stores open for one year) reported by 78 stores of seven retailers: Dayton Hudson, Federated, Kmart, May, J.C. Penney, Sears and Wal-Mart.
| ICSC-UBS (SA, 1977=100) | 02/18/06 | 02/11/06 | Y/Y | 2005 | 2004 | 2003 |
|---|---|---|---|---|---|---|
| Total Weekly Chain Store Sales | 461.9 | 460.9 | 3.7% | 3.6% | 4.7% | 2.9% |
by Carol Stone February 22, 2006
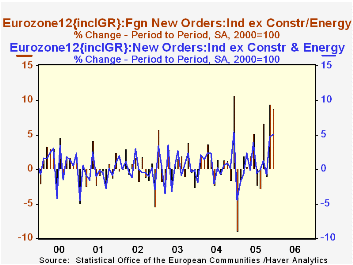
Yesterday in this space, Louise Curley noted a "stunning" rise in new orders at French factories in Q4 2005. That commentary followed a similar sentiment about orders in Italy for December, which were reported Monday. Now today, Eurostat tells that new orders for the Euro-Zone as a whole closed out 2005 with two upbeat months. Total orders gained 4.6% in November and 5.0% in December (month-on-month, seasonally adjusted). Foreign orders rose 9.5% in November and 8.8% in December. For the year as a whole, foreign orders were 9.0% higher than in 2004 while total orders were up 4.8%.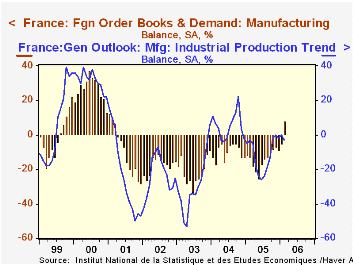
The results of France INSEE's monthly business survey hint of further improvement early this year. Total orders had diffusion index readings of -12 and -8 in January and February, respectively, a far cry from the -20 range that prevailed in mid-2005. Export orders ran up from -5 in January to +8 in February, the first positive reading since March 2001. The anticipated trend in industrial production is hovering just below zero, also much less weak than the -26 found in June of 2005 and the -12 average for the year.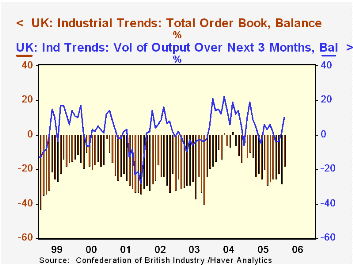
Across the Channel, the UK also still sees more firms with falling orders than rising, according to the Confederation of British Industry monthly survey, but these negative numbers are diminishing. February's total orders stood at -18, compared with -28 in January and a -21 average for all of last year. Export orders fell back from -10 in January to -17 in February, but they had stood at -23 in December and had also averaged -21 for all of 2005. Expectations for near-term output show it at +10, the highest monthly reading since February 2005.
The trends in these factory prospects look uneven and the still sluggish domestic sectors disappointing. But persistent gains in exporting can help turn that around.
| Feb 2006 | Jan 2006 | Dec 2005 | Nov 2005 | 2005 | 2004 | 2003 | |
|---|---|---|---|---|---|---|---|
| Euro-Zone Total Orders (% Change) | -- | -- | 5.0 | 4.6 | 4.8 | 6.1 | 0.1 |
| Foreign Orders (% Change) | -- | -- | 8.8 | 9.5 | 9.0 | 7.9 | 0.6 |
| France INSEE Survey, Industrial Production Trend | -3 | 0 | -2 | 0 | -12 | 5 | -29 |
| Export Orders | 8 | -5 | -9 | -7 | -14 | -10 | -21 |
| UK CBI Survey Orders | -18 | -28 | -22 | -25 | -21 | -9 | -29 |
| Export Orders | -17 | -10 | -23 | -13 | -21 | -13 | -33 |
| Output Next 3 Months | 10 | 1 | -4 | -4 | 4 | 12 | -3 |

Tom Moeller
AuthorMore in Author Profile »Prior to joining Haver Analytics in 2000, Mr. Moeller worked as the Economist at Chancellor Capital Management from 1985 to 1999. There, he developed comprehensive economic forecasts and interpreted economic data for equity and fixed income portfolio managers. Also at Chancellor, Mr. Moeller worked as an equity analyst and was responsible for researching and rating companies in the economically sensitive automobile and housing industries for investment in Chancellor’s equity portfolio. Prior to joining Chancellor, Mr. Moeller was an Economist at Citibank from 1979 to 1984. He also analyzed pricing behavior in the metals industry for the Council on Wage and Price Stability in Washington, D.C. In 1999, Mr. Moeller received the award for most accurate forecast from the Forecasters' Club of New York. From 1990 to 1992 he was President of the New York Association for Business Economists. Mr. Moeller earned an M.B.A. in Finance from Fordham University, where he graduated in 1987. He holds a Bachelor of Arts in Economics from George Washington University.
More Economy in Brief


