 Global| Aug 03 2006
CPI Inflation in Turkey & Macedonia: Up, but Not High
Summary
Inflation in Turkey has picked up a bit in recent months, but remains quite modest compared with Turkey's historical experience. The CPI in July was up 1.7% from June, seasonally adjusted (by Haver Analytics), and 11.7% from a year [...]
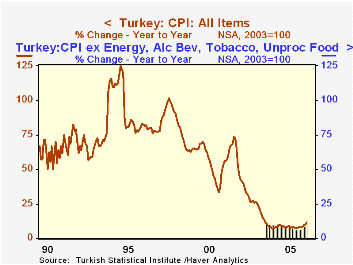
Inflation in Turkey has picked up a bit in recent months, but remains quite modest compared with Turkey's historical experience. The CPI in July was up 1.7% from June, seasonally adjusted (by Haver Analytics), and 11.7% from a year ago. June and May were both up about 10% from year-earlier levels. Our standard table shows only the last three years of data and for this period, these recent numbers would look a bit discouraging. Nonetheless, these are low. As recently as 2002, inflation ran just under 30% and from early 1994 to late 1998, the lowest 12-month reading was 75.7%, with numerous months above 100%.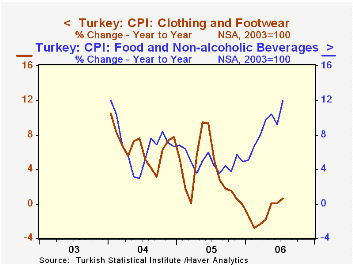
Since 2003, the Turkish Statistical Institute has published some detail data. As seen in the graph, food prices are one of the sources of the recent rise in inflation. Actually so are clothing prices, but at a much lower level: year-on-year changes were in fact negative in the first few months of 2006, but that index has stabilized and even risen slightly in May, June and July. Otherwise, we see that various measures of "core" inflation are not much affected by the exclusion of food, energy and administered prices.
Note that Turkey data offerings are contained in Haver's EMERGEMA database, which includes Middle Eastern and African countries.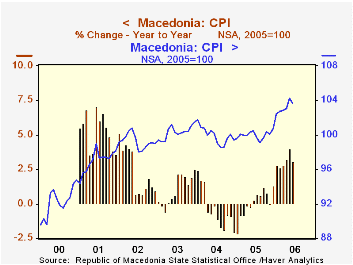
Haver is also accumulating a growing amount of data on other emerging markets. Late yesterday, the Statistical Office of Macedonia reported its consumer prices for June. These data are included in EMERGECW, along with other Central, Southern and Eastern European countries. Macedonia's total CPI began in 2000, with a standard breakdown starting in 2004. Over the time span available, inflation in that small nation (about the size of Vermont, according to the CIA's "World Factbook") has been quite modest. In June, the total index was 3.1% above June 2005, also a pickup the couple of years. In 2005 overall, the index rose just 1.3% and it fell in 2004 by 2.1%. Among components, food, energy and home furnishings all saw price weakness through part or all of 2005, but they have since firmed. However, their rates generally remain lower than elsewhere, with housing and utilities costs rising 1.3% in June and transportation 10.0%.
| CPI% Changes | July 2006 | June 2006 | May 2006 | December/December|||
|---|---|---|---|---|---|---|
| 2005 | 2004 | 2003 | ||||
| Turkey: SA, Mo/Mo | 1.7 | 1.2 | 2.1 | -- | -- | -- |
| NSA, Yr/Yr | 11.7 | 10.1 | 9.9 | 7.7 | 9.4 | 12.7 |
| Ex Energy | 11.2 | 9.6 | 9.9 | 7.8 | 8.7 | 12.2* |
| Ex Energy, Others** | 10.5 | 9.0 | 8.7 | 6.6 | 9.9 | 11.5* |
| Macedonia | -- | 3.1 | 4.0 | 1.3 | -2.1 | 2.5 |
Carol Stone, CBE
AuthorMore in Author Profile »Carol Stone, CBE came to Haver Analytics in 2003 following more than 35 years as a financial market economist at major Wall Street financial institutions, most especially Merrill Lynch and Nomura Securities. She had broad experience in analysis and forecasting of flow-of-funds accounts, the federal budget and Federal Reserve operations. At Nomura Securities, among other duties, she developed various indicator forecasting tools and edited a daily global publication produced in London and New York for readers in Tokyo. At Haver Analytics, Carol was a member of the Research Department, aiding database managers with research and documentation efforts, as well as posting commentary on select economic reports. In addition, she conducted Ways-of-the-World, a blog on economic issues for an Episcopal-Church-affiliated website, The Geranium Farm. During her career, Carol served as an officer of the Money Marketeers and the Downtown Economists Club. She had a PhD from NYU's Stern School of Business. She lived in Brooklyn, New York, and had a weekend home on Long Island.
More Economy in Brief


