 Global| Mar 23 2005
CPI Gain The Strongest Since October
by:Tom Moeller
|in:Economy in Brief
Summary
Consumer Prices (CPI-U) rose 0.4% in February, the strongest monthly increase since October and exceeded Consensus expectations for a 0.3% rise. A 0.3% gain in prices less food & energy also was the firmest since last September and [...]
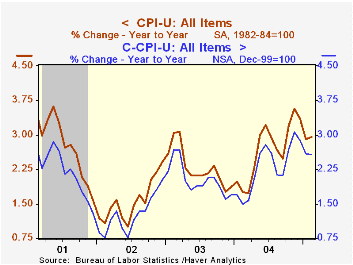
Consumer Prices (CPI-U) rose 0.4% in February, the strongest monthly increase since October and exceeded Consensus expectations for a 0.3% rise.
A 0.3% gain in prices less food & energy also was the firmest since last September and beat expectations for a 0.2% increase.
Services price inflation firmed slightly last month and caused the acceleration. Less energy, services prices rose 0.3% versus 0.2% gains during the prior four months. Shelter price inflation moved slightly higher to 0.3% (3.0% y/y) and medical care services prices ramped to a 0.6% (5.0% y/y) gain after four months at 0.4%. Public transportation prices were unchanged (-1.0% y/y) following two months of decline but school tuition rose 0.5% (6.5% y/y).
Goods prices less energy were unchanged (0.7% y/y) after a 0.3% January gain despite a 0.4% (5.0% y/y) increase in tobacco prices. New vehicle prices rose just 0.1% (1.1% y/y) while apparel prices (0.0% y/y) and furniture prices (0.3% y/y) both fell 0.2%. Personal computer prices also fell 3.6% (NSA, -15.6% y/y).
Energy prices moved up 2.0%. Gasoline prices rose 3.2% (14.7% y/y) last month and so far in March gasoline prices have moved roughly another 10% higher to $2.11 per gallon. Fuel oil prices rose 1.4% (21.5% y/y) and natural gas & electricity prices rose 0.8% (5.1% y/y).
Food prices rose 0.1% for the second month, the gain held back by another decline in fruit & vegetable prices (+2.3% y/y).
The chained CPI which adjusts for shifts in the mix of consumer purchases jumped 0.5%. Core chain prices also rose a strong 0.6%.
| Consumer Price Index | Feb | Jan | Y/Y | 2004 | 2003 | 2002 |
|---|---|---|---|---|---|---|
| Total | 0.4% | 0.1% | 2.9% | 2.7% | 2.3% | 1.6% |
| Total less Food & Energy | 0.3% | 0.2% | 2.3% | 1.8% | 1.5% | 2.3% |
| Goods less Food & Energy | 0.0% | 0.3% | 0.7% | -0.9% | -2.0% | -1.1% |
| Services less Energy | 0.3% | 0.2% | 2.9% | 2.8% | 2.9% | 3.8% |
| Energy | 2.0% | -1.1% | 10.3% | 10.9% | 12.2% | -5.9% |
| Food | 0.1% | 0.1% | 2.6% | 3.4% | 2.1% | 1.8% |
| Chained CPI: Total (NSA) | 0.5% | 0.2% | 2.6% | 2.3% | 2.0% | 1.3% |
| Total less Food & Energy | 0.6% | 0.2% | 2.0% | 1.5% | 1.1% | 1.9% |
by Tom Moeller March 23, 2005
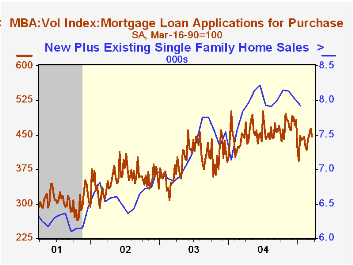
The Mortgage Bankers Association reported that mortgage applications dropped 9.5% last week and pulled the average level in March 4.1% below February.
Applications to refinance plummeted 16.5% leaving the February average off 13.5% from February.
Purchase applications fell for the first week in the last four. The 3.5% decline still left purchase applications 5.1% higher than in February.
The effective interest rate on a conventional 30-year mortgage rose to 6.19% from 6.16% the prior week and from 5.85% in February. The effective rate on a 15-year mortgage also rose to 5.81%.
The Mortgage Bankers Association surveys between 20 to 35 of the top lenders in the U.S. housing industry to derive its refinance, purchase and market indexes. The weekly survey accounts for more than 40% of all applications processed each week by mortgage lenders. Visit the Mortgage Bankers Association site here.
| MBA Mortgage Applications (3/16/90=100) | 03/18/05 | 03/11/05 | Y/Y | 2004 | 2003 | 2002 |
|---|---|---|---|---|---|---|
| Total Market Index | 658.8 | 727.6 | -40.9% | 735.1 | 1,067.9 | 799.7 |
| Purchase | 446.4 | 462.8 | -0.6% | 454.5 | 395.1 | 354.7 |
| Refinancing | 1,894.4 | 2,267.5 | -62.0% | 2,366.8 | 4,981.8 | 3,388.0 |
by Carol Stone March 23, 2005
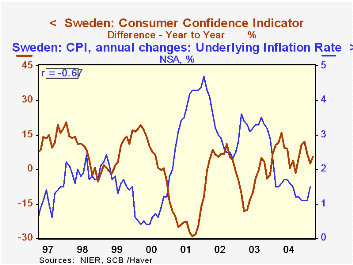
Consumer confidence is little changed this month in three European countries. In Sweden, the monthly "CCI" indicator, eased from +11.6% to +10.7%; Italy's index also decreased, by 0.3% to 104.1 from 104.4 in February. The balance indicator in the Netherlands edged "up" to -21 from -22. These three movements indicate moderate improvements in all three countries over the last year, but in the two for which buying plans are also reported, there is little willingness to increase spending.
In Sweden, the distinctive feature about the recent behavior of the "CCI" is the narrow range of its movement. Through the 1990s and up to 2002, this indicator moved down and up in wide cyclical swings, or in shorter oscillations. In contrast, over the last 18 months or so, it has held to a narrow range, maintaining similar, moderately positive readings from month to month. This pattern coincides with relative stability of the kronor against the euro. It also corresponds to a period of near stability in Swedish consumer prices (see graph). Since February 2004, year-on-year inflation in Sweden has hovered between 1.1% and 1.7%, gauged according to the so-called "underlying" rate. The steadiness of the price situation at such low inflation rates is most probably encouraging to consumers.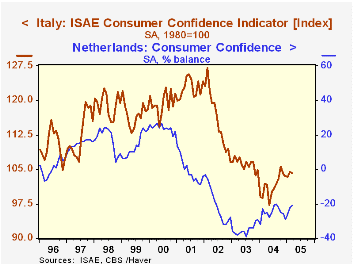
Dutch consumers seem encouraged by what they perceive as a better outlook for the Dutch economy as a whole, a component of this survey which has moved in parallel with overall confidence since the middle of 2003. However, this seems not to translate into ideas about spending more, as the "willingness to buy" component has hardly moved over the same time span. In the Netherlands, improvements in the economic climate are relative: the climate index is still negative, but less so. Similarly, employment is no longer falling, but it has been no more than holding its own in recent months. We'd surmise that until employment actually turns consistently upward, the "willingness to buy" indicator will sustain its recent sluggish readings.
The improvement in Italian confidence is relative too. While the index based on 1980 values has gained since early last year, the components expressed as favorable-less-unfavorable balances remain mostly negative, some quite strongly so. Thus, hesitation and uncertainty seem to be the order of the day with the result that "current intention to make major purchases" is the most negative item in the survey.
| Mar 2005 | Feb 2005 | Year Ago | 2004 | 2003 | 2002 | |
|---|---|---|---|---|---|---|
| Sweden (% Balance) | 10.7 | 11.6 | 5.1 | 8.7 | 0.9 | 7.2 |
| Netherlands (% Balance) | -21 | -22 | -26 | -25 | -35 | -20 |
| Italy (1980 = 100) | 104.1 | 104.4 | 101.8 | 101.4 | 106.1 | 115.8 |

Tom Moeller
AuthorMore in Author Profile »Prior to joining Haver Analytics in 2000, Mr. Moeller worked as the Economist at Chancellor Capital Management from 1985 to 1999. There, he developed comprehensive economic forecasts and interpreted economic data for equity and fixed income portfolio managers. Also at Chancellor, Mr. Moeller worked as an equity analyst and was responsible for researching and rating companies in the economically sensitive automobile and housing industries for investment in Chancellor’s equity portfolio. Prior to joining Chancellor, Mr. Moeller was an Economist at Citibank from 1979 to 1984. He also analyzed pricing behavior in the metals industry for the Council on Wage and Price Stability in Washington, D.C. In 1999, Mr. Moeller received the award for most accurate forecast from the Forecasters' Club of New York. From 1990 to 1992 he was President of the New York Association for Business Economists. Mr. Moeller earned an M.B.A. in Finance from Fordham University, where he graduated in 1987. He holds a Bachelor of Arts in Economics from George Washington University.
More Economy in Brief


