 Global| Feb 19 2010
CPI Firms With Energy Prices ButCore Prices Decline
by:Tom Moeller
|in:Economy in Brief
Summary
Consumer price inflation remains under wraps. That's the message from this morning's report by the U.S. Bureau of Labor Statistics that the January CPI rose 0.2% for the fifth consecutive month. The increase was slightly lower than [...]
 Consumer
price inflation remains under wraps. That's the message from this
morning's report by the U.S. Bureau of Labor Statistics that the
January CPI rose 0.2% for the fifth consecutive month. The increase was
slightly lower than Consensus expectations for a 0.3% gain though it
was part of the CPI's accelerated y/y increase of 2.7% versus the -2.0%
reading as of last July. On Wednesday the seasonally adjusted CPI
figures were revised back to 2005.
Consumer
price inflation remains under wraps. That's the message from this
morning's report by the U.S. Bureau of Labor Statistics that the
January CPI rose 0.2% for the fifth consecutive month. The increase was
slightly lower than Consensus expectations for a 0.3% gain though it
was part of the CPI's accelerated y/y increase of 2.7% versus the -2.0%
reading as of last July. On Wednesday the seasonally adjusted CPI
figures were revised back to 2005.
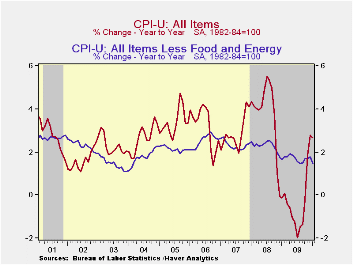
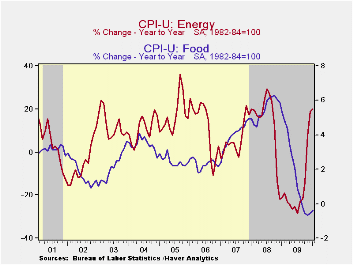
The acceleration noted above is the result of higher energy prices which rose 2.8% last month and by 19.8% during the last twelve. For January the rise reflected a 4.4% spurt in gasoline prices which have risen by one-half during the last twelve months. Fuel oil prices also jumped 6.9% (13.6% y/y) but natural gas & electricity prices were roughly unchanged from December and down 4.6% y/y.
Food & beverage prices continued weak. They posted a moderate 0.2% January increase but a 0.2% decline versus last year. Dairy prices jumped 2.1% in January yet remained down 5.1% y/y. Fruit & vegetable costs showed the same pattern. They rose 1.3% last month but were off 1.2% y/y. In the same vein, prices for meats, poultry, fish & eggs rose 0.4% but were down 3.2% y/y. The restraint on the monthly food price increase came from a 0.5% decline in cereal & bakery product prices (-1.5% y/y) and a modest 0.1% uptick (1.6% y/y) in the cost of eating out. Alcoholic beverage prices also rose just 0.1% (1.5% y/y) following strength during the last fifteen years.
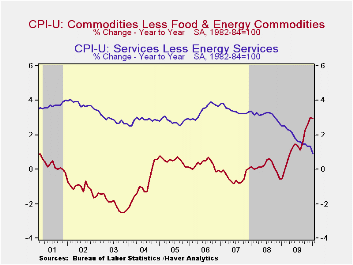
Core consumer prices remained weak. They posted a 0.1% decline, the first negative reading since 1982, as earlier strength in core goods prices tapered off. Their 0.1% January uptick was part of a reduced 1.7% (AR) increase during the last three months. That compares to a 5.4% three-month gain as of last April. The monthly increase in tobacco prices tapered off to 0.4% (29.5% y/y) and new & used motor vehicles prices rose just 0.2% (5.4% y/y). Also easing were apparel prices which fell 0.1% (+1.7% y/y). It was the third decline in the last four months. Continuing weak were prices for household furnishings & operation, off 0.1% (-1.2% y/y) for the ninth straight month of decline.
Core services prices continued weak with a 0.2% decline (+0.9% y/y), the first drop since 1982. Weakness in the housing market caused a 0.5% decline in shelter prices which are off 0.3% y/y. Owners equivalent rent of primary residences, a measure not equivalent to other house price measures, slipped further from a June peak and rose just 0.4% during the last twelve months. Elsewhere in services, public transportation prices fell 1.8% (+2.8% y/y) while medical care services prices continued steadily upward by 0.5% (3.5% y/y). Finally, education costs remained strong with a 0.3% increase (4.6% y/y) but recreation prices slipped for the fifth straight month (0.4% y/y).
The chained CPI, which adjusts for shifts in consumption patterns rose 0.4% last month and rose 3.6% year-to-year. Conversely, chained prices less food & energy slipped marginally (+1.5% y/y).
The consumer price data is available in Haver's USECON database while detailed figures can be found in the CPIDATA database.
Modifications to the terms of the discount window lending programs by the Federal Reserve Board can be found here.
| Consumer Price Index (%) | January | December | November | Jan. y/y | 2009 | 2008 | 2007 |
|---|---|---|---|---|---|---|---|
| Total | 0.2 | 0.2 | 0.2 | 2.7 | -0.3 | 3.8 | 2.9 |
| Total less Food & Energy | -0.1 | 0.1 | 0.0 | 1.5 | 1.7 | 2.3 | 2.3 |
| Goods less Food & Energy | 0.1 | 0.1 | 0.2 | 3.0 | 1.3 | 0.1 | -0.4 |
| Services less Energy | -0.2 | 0.1 | -0.0 | 0.9 | 1.9 | 3.1 | 3.4 |
| Energy | 2.8 | 0.8 | 2.2 | 19.8 | -18.1 | 13.7 | 5.6 |
| Food & Beverages | 0.2 | 0.1 | 0.1 | -0.2 | -0.2 | 5.4 | 3.9 |
| Chained CPI: Total (NSA) | 0.4 | 0.8 | 0.0 | 3.6 | -0.4 | 3.3 | 2.5 |
| Total less Food & Energy | -0.0 | 0.1 | -0.2 | 1.5 | 1.3 | 1.9 | 1.9 |
by Robert Brusca February 19, 2010
 The
Markit
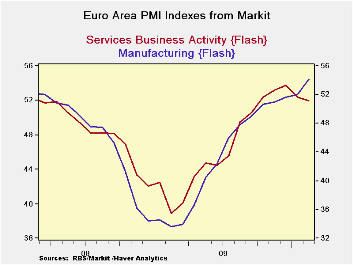
PMIs are sensitive gauges measuring the breadth of the expansion in
manufacturing and services industries in the e-Zone. This month the MFG
PMI was above its neutral reading of 50 for the fifth month in a row.
In each of these five months MFG has accelerated improving its mark
above the neutral 50 readings.
The
Markit
PMIs are sensitive gauges measuring the breadth of the expansion in
manufacturing and services industries in the e-Zone. This month the MFG
PMI was above its neutral reading of 50 for the fifth month in a row.
In each of these five months MFG has accelerated improving its mark
above the neutral 50 readings.
Not so for services.
For the services, the index was also above 50 – and for the sixth consecutive month. But the services gauge has now fallen for two months in a row. It is not building momentum, it is losing momentum. The services reading at 51.97 is now the weakest reading for this sector since September 2009 when it first popped above the neutral 50 mark and began to signal growth. Since this sector is the job-creating sector, backtracking in services is very worrisome.
True, the services sector still is expanding. At 51.97 it stands above the neutral mark of 50. But momentum is being lost and the margin above 50 for services is small. The services reading is below its lifetime average of 53.67 so it is far below normal even though the sector it technically still registering growth. Growth does not imply normalcy.
Compare that to the manufacturing index which at 54.13 has been steadily accelerating and stands above its lifetime average reading of 51.12. Manufacturing seems to be pointing the way ahead.
But from other reports we know that one of the problems in the Zone is that it has benefitted from export led growth, and that has favored the manufacturing sector. It’s a problem because the very name suggests that the Zone has not cultivated its own domestic demand. And we see that loud and clear in this report. While some services do get exported, goods are far more likely to be exported than are services. The strength in manufacturing stems from some considerable strength in Euro-Area export orders. Meanwhile, the weakness at home has held back domestic demand. Just today the UK (an EU member not an EMU member) posted a sharp drop in retail sales, although weather seems to have been a prime culprit there. The overriding point for Europe is that it has not cultivated domestic demand; it is living off of demand rebounds elsewhere. And Europe is too big to be carried for long in that fashion by the global economy.
The weakness in its own services sector reasonably leads us to wonder if Europe’s export growth will be enough to sustain it until job growth, the services sector and domestic demand- three highly inter-linked factors - kick into gear.
Suffice it to say that Europe’s report is not reassuring and its growth seems to be as much at risk as at anytime in this nascent expansion period.
| FLASH Readings | ||
|---|---|---|
| Markit PMIs for the Euro-Area | ||
| MFG | Services | |
| Feb-10 | 54.13 | 51.97 |
| Jan-10 | 52.39 | 52.50 |
| Dec-09 | 51.59 | 53.63 |
| Nov-10 | 51.20 | 53.04 |
| Segment Averages | ||
| 3-Mo | 51.73 | 52.67 |
| 6-MO | 50.57 | 52.36 |
| 12-Mo | 44.78 | 48.47 |
| 136-Mo Range | ||
| High | 60.47 | 62.36 |
| Low | 33.55 | 39.24 |
| % Range | 76.4% | 55.1% |
| Range | 26.92 | 23.12 |
| Q3-2007 | 51.12 | 53.67 |
by Carol Stone February 19, 2010
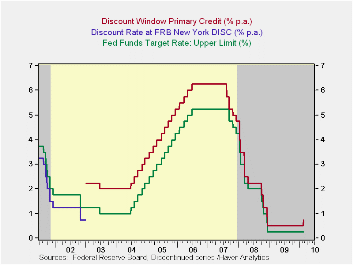 Yesterday,
February 18, the Federal Reserve Board announced several changes to the
extraordinary liquidity measures it instituted to help alleviate the
recent financial crisis. Just last week, Tom Moeller described here how
extensive those liquidity provisions have been for just one part of the
program, the Term Auction Facility. Even as that effort winds down – it
will be concluded altogether with a final auction on March 8,
yesterday’s announced said – the Fed Board is also pulling back or
diminishing some of its other emergency operations. In particular, the
old “discount window”, which is now also called “primary credit”, sees
its rate raised from 50 basis points (0.50%) to 75 basis points
(0.75%). · As the Fed’s statement explains, this move increases the
spread of the primary credit, or discount, rate to 50 basis points over
the high end of the FOMC’s target for the federal funds rate, as shown
in the chart. The chart also shows the altered treatment of the
discount window beginning in 2003. Previously, the discount rate
hovered just below coincident fed funds rates, but it was changed in
January that year to a penalty rate, pegged at some spread over the
funds rate.
Yesterday,
February 18, the Federal Reserve Board announced several changes to the
extraordinary liquidity measures it instituted to help alleviate the
recent financial crisis. Just last week, Tom Moeller described here how
extensive those liquidity provisions have been for just one part of the
program, the Term Auction Facility. Even as that effort winds down – it
will be concluded altogether with a final auction on March 8,
yesterday’s announced said – the Fed Board is also pulling back or
diminishing some of its other emergency operations. In particular, the
old “discount window”, which is now also called “primary credit”, sees
its rate raised from 50 basis points (0.50%) to 75 basis points
(0.75%). · As the Fed’s statement explains, this move increases the
spread of the primary credit, or discount, rate to 50 basis points over
the high end of the FOMC’s target for the federal funds rate, as shown
in the chart. The chart also shows the altered treatment of the
discount window beginning in 2003. Previously, the discount rate
hovered just below coincident fed funds rates, but it was changed in
January that year to a penalty rate, pegged at some spread over the
funds rate. 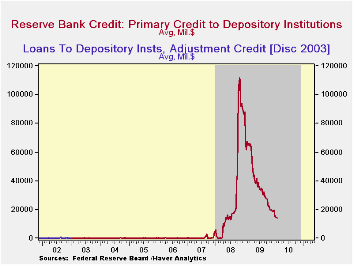 Generally this has been 1 percentage point, 100 basis
points. Part of the emergency liquidity boost beginning in August 2007
was making these funds cheaper for borrowing banks by cutting the
spread, first to 50 basis points, and then in March 2008, to 25 basis
points, where it has been until today, when the hike to 50 took
effect.
Generally this has been 1 percentage point, 100 basis
points. Part of the emergency liquidity boost beginning in August 2007
was making these funds cheaper for borrowing banks by cutting the
spread, first to 50 basis points, and then in March 2008, to 25 basis
points, where it has been until today, when the hike to 50 took
effect.
The second graph shows the amount of this primary credit. This is similar to, but not exactly the same as the old “adjustment credit” in the pre-2003 procedures. The idea then was that banks avoided the discount window like the plague, so there was rarely any use of it at all. You can see the spike over the 9/11 period, which was, up to mid-2008, by far the record amount of borrowing. The philosophy was changing though; the rate was made higher than other sources of funds, but banks theoretically wouldn’t be stigmatized by availing themselves of it. In the easy-money period of those mid-2000s, hardly any ever needed to anyway. All this changed in 2007 and 2008. The Fed Board cut the spread with the express intention of helping banks get money. At the peak in late October and early November 2008, banks were borrowing more than $100 billion in this one facility alone. More recently, this has shrunk markedly, to “just” $14.3 billion in the Fed’s statement week ended this past Wednesday.
Some wonder if this action by the Fed is a “tightening”, even though their statement argues that it is not. It certainly is the first action involving a rate. But they have already reined in their “quantitative” easing substantially, and this newest can thus be seen as part of a progression toward non-emergency conditions. They further indicated that the maturity of the primary credit borrowing, which has been as long as 90 days, will be shortened to the more typical overnight on March 18. So there are several steps here, and in one sense, they are reactive, not pro-active. They seem to be a response to smoother money market conditions rather that an attempt to disrupt the markets and alter the underlying demand conditions. So technically, this would not be a “tightening”. But it is a “de-easing”, which must, by definition, come first.
The Fed’s statement is here . The rates and borrowing amounts are contained in Haver’s DAILY and WEEKLY databases, with monthly averages in USECON.

Tom Moeller
AuthorMore in Author Profile »Prior to joining Haver Analytics in 2000, Mr. Moeller worked as the Economist at Chancellor Capital Management from 1985 to 1999. There, he developed comprehensive economic forecasts and interpreted economic data for equity and fixed income portfolio managers. Also at Chancellor, Mr. Moeller worked as an equity analyst and was responsible for researching and rating companies in the economically sensitive automobile and housing industries for investment in Chancellor’s equity portfolio. Prior to joining Chancellor, Mr. Moeller was an Economist at Citibank from 1979 to 1984. He also analyzed pricing behavior in the metals industry for the Council on Wage and Price Stability in Washington, D.C. In 1999, Mr. Moeller received the award for most accurate forecast from the Forecasters' Club of New York. From 1990 to 1992 he was President of the New York Association for Business Economists. Mr. Moeller earned an M.B.A. in Finance from Fordham University, where he graduated in 1987. He holds a Bachelor of Arts in Economics from George Washington University.
More Economy in Brief


