 Global| Feb 19 2010
CPI Firms With Energy Prices But Core Prices Decline
by:Tom Moeller
|in:Economy in Brief
Summary
Consumer price inflation remains under wraps. That's the message from this morning's report by the U.S. Bureau of Labor Statistics that the January CPI rose 0.2% for the fifth consecutive month. The increase was slightly lower than [...]
 Consumer
price inflation remains under wraps. That's the message from this
morning's report by the U.S. Bureau of Labor Statistics that the
January CPI rose 0.2% for the fifth consecutive month. The increase was
slightly lower than Consensus expectations for a 0.3% gain though it
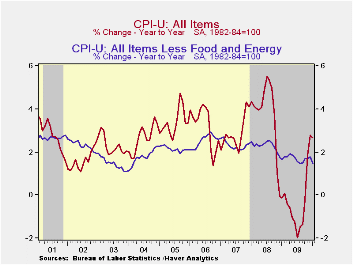
was part of the CPI's accelerated y/y increase of 2.7% versus the -2.0%
reading as of last July. On Wednesday the seasonally adjusted CPI
figures were revised back to 2005.
Consumer
price inflation remains under wraps. That's the message from this
morning's report by the U.S. Bureau of Labor Statistics that the
January CPI rose 0.2% for the fifth consecutive month. The increase was
slightly lower than Consensus expectations for a 0.3% gain though it
was part of the CPI's accelerated y/y increase of 2.7% versus the -2.0%
reading as of last July. On Wednesday the seasonally adjusted CPI
figures were revised back to 2005.
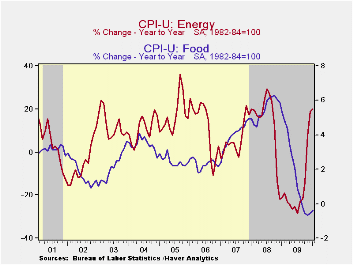
The acceleration noted above is the result of higher energy prices which rose 2.8% last month and by 19.8% during the last twelve. For January the rise reflected a 4.4% spurt in gasoline prices which have risen by one-half during the last twelve months. Fuel oil prices also jumped 6.9% (13.6% y/y) but natural gas & electricity prices were roughly unchanged from December and down 4.6% y/y.
Food & beverage prices continued weak. They posted a moderate 0.2% January increase but a 0.2% decline versus last year. Dairy prices jumped 2.1% in January yet remained down 5.1% y/y. Fruit & vegetable costs showed the same pattern. They rose 1.3% last month but were off 1.2% y/y. In the same vein, prices for meats, poultry, fish & eggs rose 0.4% but were down 3.2% y/y. The restraint on the monthly food price increase came from a 0.5% decline in cereal & bakery product prices (-1.5% y/y) and a modest 0.1% uptick (1.6% y/y) in the cost of eating out. Alcoholic beverage prices also rose just 0.1% (1.5% y/y) following strength during the last fifteen years.
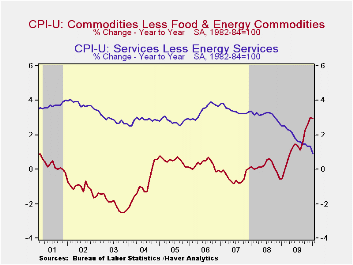
Core consumer prices remained weak. They posted a 0.1% decline, the first negative reading since 1982, as earlier strength in core goods prices tapered off. Their 0.1% January uptick was part of a reduced 1.7% (AR) increase during the last three months. That compares to a 5.4% three-month gain as of last April. The monthly increase in tobacco prices tapered off to 0.4% (29.5% y/y) and new & used motor vehicles prices rose just 0.2% (5.4% y/y). Also easing were apparel prices which fell 0.1% (+1.7% y/y). It was the third decline in the last four months. Continuing weak were prices for household furnishings & operation, off 0.1% (-1.2% y/y) for the ninth straight month of decline.
Core services prices continued weak with a 0.2% decline (+0.9% y/y), the first drop since 1982. Weakness in the housing market caused a 0.5% decline in shelter prices which are off 0.3% y/y. Owners equivalent rent of primary residences, a measure not equivalent to other house price measures, slipped further from a June peak and rose just 0.4% during the last twelve months. Elsewhere in services, public transportation prices fell 1.8% (+2.8% y/y) while medical care services prices continued steadily upward by 0.5% (3.5% y/y). Finally, education costs remained strong with a 0.3% increase (4.6% y/y) but recreation prices slipped for the fifth straight month (0.4% y/y).
The chained CPI, which adjusts for shifts in consumption patterns rose 0.4% last month and rose 3.6% year-to-year. Conversely, chained prices less food & energy slipped marginally (+1.5% y/y).
The consumer price data is available in Haver's USECON database while detailed figures can be found in the CPIDATA database.
Modifications to the terms of the discount window lending programs by the Federal Reserve Board can be found here.
| Consumer Price Index (%) | January | December | November | Jan. y/y | 2009 | 2008 | 2007 |
|---|---|---|---|---|---|---|---|
| Total | 0.2 | 0.2 | 0.2 | 2.7 | -0.3 | 3.8 | 2.9 |
| Total less Food & Energy | -0.1 | 0.1 | 0.0 | 1.5 | 1.7 | 2.3 | 2.3 |
| Goods less Food & Energy | 0.1 | 0.1 | 0.2 | 3.0 | 1.3 | 0.1 | -0.4 |
| Services less Energy | -0.2 | 0.1 | -0.0 | 0.9 | 1.9 | 3.1 | 3.4 |
| Energy | 2.8 | 0.8 | 2.2 | 19.8 | -18.1 | 13.7 | 5.6 |
| Food & Beverages | 0.2 | 0.1 | 0.1 | -0.2 | -0.2 | 5.4 | 3.9 |
| Chained CPI: Total (NSA) | 0.4 | 0.8 | 0.0 | 3.6 | -0.4 | 3.3 | 2.5 |
| Total less Food & Energy | -0.0 | 0.1 | -0.2 | 1.5 | 1.3 | 1.9 | 1.9 |

Tom Moeller
AuthorMore in Author Profile »Prior to joining Haver Analytics in 2000, Mr. Moeller worked as the Economist at Chancellor Capital Management from 1985 to 1999. There, he developed comprehensive economic forecasts and interpreted economic data for equity and fixed income portfolio managers. Also at Chancellor, Mr. Moeller worked as an equity analyst and was responsible for researching and rating companies in the economically sensitive automobile and housing industries for investment in Chancellor’s equity portfolio. Prior to joining Chancellor, Mr. Moeller was an Economist at Citibank from 1979 to 1984. He also analyzed pricing behavior in the metals industry for the Council on Wage and Price Stability in Washington, D.C. In 1999, Mr. Moeller received the award for most accurate forecast from the Forecasters' Club of New York. From 1990 to 1992 he was President of the New York Association for Business Economists. Mr. Moeller earned an M.B.A. in Finance from Fordham University, where he graduated in 1987. He holds a Bachelor of Arts in Economics from George Washington University.
More Economy in Brief


