 Global| Nov 16 2006
CPI Again Fell 0.5%, Core Increase Lightest Since February
by:Tom Moeller
|in:Economy in Brief
Summary
The consumer price index (CPI-U) fell 0.5% during October for the second consecutive month and the decline outpaced expectations for a 0.3% drop. Together, the declines were the largest on record. Energy prices about repeated the [...]
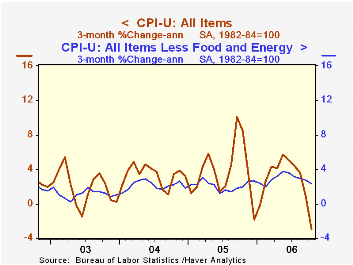
The consumer price index (CPI-U) fell 0.5% during October for the second consecutive month and the decline outpaced expectations for a 0.3% drop. Together, the declines were the largest on record.
Energy prices about repeated the prior month's weakness and fell 7.0% as gasoline prices dropped 11.1% (-18.3% y/y) and fuel oil prices fell 6.1% (-7.7% y/y) for the second month. Gasoline prices have since fallen another 1.3% m/m so far in November to an average $2.22 per gallon. Natural gas prices were down as well by 7.7% (-24.0% y/y) & electricity prices slipped 0.2% (+10.4% y/y).
The 0.1% rise in prices less food & energy was the weakest since a like gain this past February and fell short of Consensus expectations for a 0.2% increase.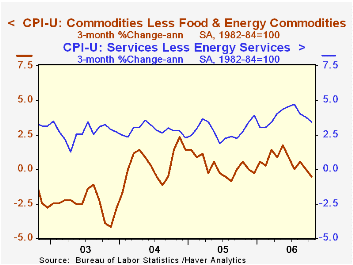
Core goods prices fell 0.3%, down for the third month in the last four. New & used motor vehicle prices fell 0.3% (-0.4% y/y) for the second consecutive month and apparel prices reversed all of their prior month's strength with a 0.7% (+0.6% y/y) decline. Household furnishings & operation prices were unchanged (1,.1% y/y) as were medical care commodity prices (3.3% y/y). Tobacco prices rose 0.1% (2.3 y/y).
Core services prices rose 0.3% for the second month as did shelter prices (4.0% y/y). The rental equivalence measure of owners' primary residences rose 0.4% (4.2% y/y) and rents rose 0.4% (3.9% y/y) for the fifth consecutive month. Public transportation costs fell 1.0% (+1.9% y/y) after a 0.7% September decline but education costs surged 0.6% (6.2% y/y). Medical care services prices rose 0.4% (4.2% y/y) for the third consecutive month.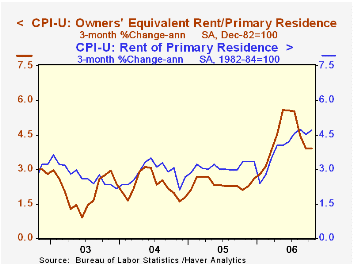
Food & beverage prices rose 0.3% led by a 0.7% jump in dairy prices (-0.3% y/y). Prices for meats, poultry, fish & eggs rose 0.2% (1.9% y/y).
The chained CPI, which adjusts for shifts in the mix of consumer purchases, fell 0.3% for the second month but less food & energy prices rose 0.3% for the second month.
The Minutes to the Latest Meeting of the Federal Open Market Committee can be found here.
| Consumer Price Index | October | September | Y/Y | 2005 | 2004 | 2003 |
|---|---|---|---|---|---|---|
| Total | -0.5% | -0.5% | 1.3% | 3.4% | 2.7% | 2.3% |
| Total less Food & Energy | 0.1% | 0.2% | 2.8% | 2.2% | 1.8% | 1.5% |
| Goods less Food & Energy | -0.3% | 0.1% | 0.2% | 0.5% | -0.9% | -2.0% |
| Services less Energy | 0.3% | 0.3% | 3.8% | 2.8% | 2.8% | 2.9% |
| Energy | -7.0% | -7.2% | -11.2% | 16.9% | 10.8% | 12.2% |
| Food & Beverages | 0.3% | 0.4% | 2.6% | 2.4% | 3.4% | 2.1% |
| Chained CPI: Total (NSA) | -0.3% | -0.3% | 1.6% | 2.9% | 2.5% | 2.0% |
| Total less Food & Energy | 0.3% | 0.3% | 2.5% | 1.9% | 1.7% | 1.1% |
by Tom Moeller November 16, 2006
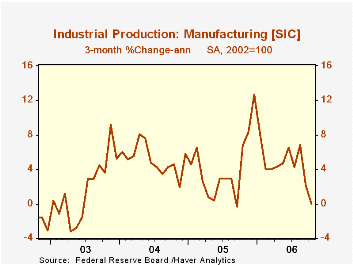
Total U.S. industrial production ticked higher 0.2% during October following the prior month's unrevised 0.6% decline. The increase just missed Consensus expectations for a 0.3% rise.The recent weakness has left output unchanged during the last three months and compares to 5-8% annual rates of growth earlier this year.
Last month's output increase was all due to a 4.1% (2.8% y/y) jump in utility output due to unseasonably cool temperatures.
Factory sector output fell 0.3% for the second consecutive month. The unchanged level of factory production during the last three months compares to a 7.9% annualized rate of growth just this past August.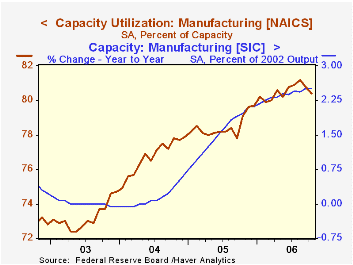
Production of durable consumer goods fell 2.6% (-6.8% y/y) due to a 4.6% decline (-11.4% y/y) in the output of automotive products. Output of appliances & furniture also fell 0.8% (-5.4% y/y) for the seventh monthly decline this year. Nondurable consumer goods output increased 0.3% (2.6% y/y) helped by a 1.4% (4.7% y/y) surge in clothing output which recovered the decline of the prior month.
Business equipment production recovered from the modest September decline with a 0.7% increase. Output of information processing & equipment surged 1.3% (15.6% y/y) but factory output overall less the hi-tech industries fell 0.5% (+2.7% y/y) for the second consecutive month. Output of transit equipment rose 0.5% (16.9% y/y).
Overall capacity utilization increased slightly to 82.2%. Factory sector utilization, however, fell to 80.4%. Factory sector capacity again rose a firm 0.2% (2.5% y/y).
The U.S. Current Account Deficit and the Expected Share of World Output from the Federal Reserve Bank of San Francisco is available here.
The Conquest of Worldwide Inflation: Currency Competition and Its Implications for Interest Rates and the Yield Curve is today's speech by Fed Governor Randall S. Kroszner and can be found here.
| Production & Capacity | October | September | Y/Y | 2005 | 2004 | 2003 |
|---|---|---|---|---|---|---|
| Industrial Production | 0.2% | -0.6% | 4.9% | 3.2% | 4.1% | 0.6% |
| Manufacturing (NAICS) | -0.3% | -0.3% | 4.4% | 3.9% | 4.8% | 0.5% |
| Consumer Goods | -0.5% | -0.9% | -0.1% | 2.1% | 2.1% | 1.0% |
| Business Equipment | 0.7% | -0.1% | 11.7% | 9.1% | 9.3% | 0.0% |
| Capacity Utilization | 82.2% | 82.1% | 79.9% (10/05) | 80.1% | 78.6% | 75.7% |
by Tom Moeller November 16, 2006
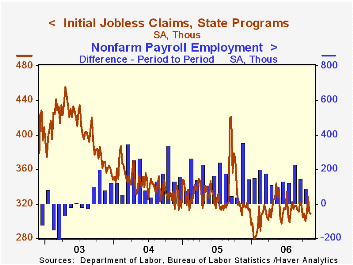
Initial claims for jobless insurance fell 2,000 to 308,000 last week from an upwardly revised reading during the prior period. Consensus expectations had been for an increase to 311,000 claims.
During the last ten years there has been a (negative) 78% correlation between the level of initial claims and the m/m change in nonfarm payroll employment.
The four-week moving average of initial claims rose slightly to 313,750 (-0.7% y/y).
Continuing claims for unemployment insurance were unchanged and have been since September.
The insured rate of unemployment remained at 1.9%.
| Unemployment Insurance (000s) | 11/11/06 | 11/04/06 | Y/Y | 2005 | 2004 | 2003 |
|---|---|---|---|---|---|---|
| Initial Claims | 308 | 310 | 0.3% | 332 | 343 | 403 |
| Continuing Claims | -- | 2,443 | -10.4% | 2,662 | 2,924 | 3,532 |
by Tom Moeller November 16, 2006
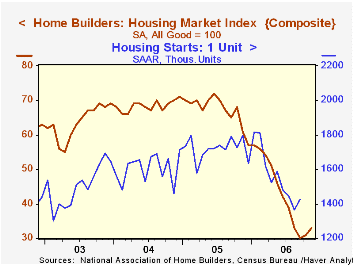
The National Association of Home Builders' (NAHB) reported that the November Composite Housing Market Index rose to 33 from 31 in October and from 31 in September. While off its low, the index remained down by roughly one half from last year.
During the last twenty years there has been a 76% correlation between the y/y change in the Composite Index and the change in single family housing starts.
The improvement again was led a sharp gain in the sub-index covering prospective sales in the next six months (9.5% m/m, -29.2% y/y). The sub-index for current sales rose just slightly m/m (-50.7% y/y).
Traffic of prospective home buyers also rose moderately to the highest level since July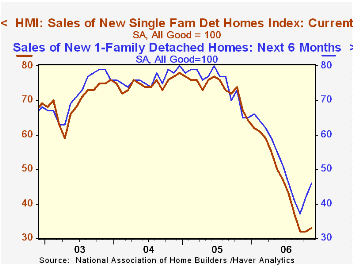
Improvement by region was mixed. The housing market indexes for the Northeast (-39.3% y/y) and the South (-41.2% y/y) improved m/m but in the Midwest the index fell (-56.8%) as it did out West (-58.0% y/y).
The NAHB index is a diffusion index based on a survey of builders. Readings above 50 signal that more builders view conditions good than poor.
Economic Freedom, Human Freedom, Political Freedom, a 1991 speech by the late Milton Friedman, is available here.
| Nat'l Association of Home Builders | November | October | Nov. '05 | 2005 | 2004 | 2003 |
|---|---|---|---|---|---|---|
| Composite Housing Market Index | 33 | 31 | 61 | 67 | 68 | 64 |
by Tom Moeller November 16, 2006
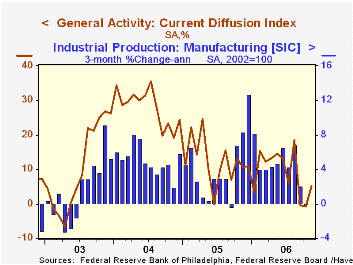
The Philadelphia Federal Reserve Bank's Index of General Business Conditions in the manufacturing sector matched expectations and improved slightly in November after two months in negative territory. At 5.1, the figure compares with -0.7 and -0.4 during October & September but remained well below the average of 12.0 during the prior eight months.
During the last ten years there has been a 65% correlation between the level of the Philadelphia Fed Business Conditions Index and three month growth in factory sector industrial production. There has been a 43% correlation with q/q growth in real GDP.
The sub indexes for shipments, unfilled orders, delivery times and the workweek each improved moderately, however, new orders and inventories fell. In addition, the employment index fell to near zero. During the last ten years there has been a 75% correlation between the employment index and the three month growth in factory payrolls.
The business conditions index reflects a separate survey question, not the sub indexes.
The prices paid index fell for the eighth month this year to the lowest level since March. During the last ten years there has been a 76% correlation between the prices paid index and the three month growth in the intermediate goods PPI. There has been an 85% correlation with the change in core intermediate goods prices.
The separate index of expected business conditions in six months fell and retraced one quarter of the prior month's improvement.
The latest Business Outlook survey from the Philadelphia Federal Reserve Bank can be found here.
Today's comments by Chicago Federal Reserve Bank President Michael H. Moskow can be found here.
| Philadelphia Fed Business Outlook | November | October | Nov. '05 | 2005 | 2004 | 2003 |
|---|---|---|---|---|---|---|
| General Activity Index | 5.1 | -0.7 | 10.7 | 12.4 | 28.0 | 10.5 |
| Prices Paid Index | 26.7 | 32.0 | 55.1 | 43.5 | 51.2 | 16.8 |
by Carol Stone November 16, 2006

The US Treasury today reported its "TIC" data for September. Besides the usual monthly flows of security purchases, there is a new compilation of summary data on short-term liabilities and on return of capital to foreign investors through such vehicles as stock swaps and repayments of principal on mortgage-backed securities. The new table is called "TIC Monthly Reports on Cross-Border Financial Flows".
The flows themselves are large, but relatively unsurprising, given the size and direction of world trade. Foreign investors continue to buy domestic US securities in size, totaling $88.0 billion in September and the same average over the past year. This year, though, they have reduced their purchases of Treasuries and increased their participation in agencies ("GSEs") and corporate bonds. The trend in purchases of corporate equities remains far smaller than other assets, but considerably larger than anytime in the past five years -- since the "dot.com" bust.
We often argue that the capital accounts do not exist simply to "finance the trade deficit". People make investment decisions based on their assessments of relative return in its own right. So we note with interest that in addition to the outflows of funds associated with the current account deficit, there are capital outflows as US investors participate in foreign financial markets. In September this amounted to nearly $23 billion and has averaged $15 billion over the past 12 months, an unprecedented amount.
Further, as the Treasury's new summary table shows, "other acquisition of long-term securities" is responsible for net capital outflows of about $12.0 billion monthly. These data have long been available, but hidden far down in the tables. This move by the Treasury to put them in a main table highlights the growing importance of these flows -- mortgage prepayments and swaps. In another helpful action, the Treasury has also summarized the detailed bank-reported data on Treasury bills and custody holdings. These perhaps can be seen as transactions that help put the "balance of payments" in balance. And they are volatile; for instance, they generated inflows of almost $30 billion in July, but outflows of nearly $11 billion in September. Over the last 12 months, net foreign acquisition of these short-term assets has averaged $9.2 billion, but there were net foreign liquidations in 2005 of almost $4 billion a month.
In a final new item, "Monthly Net TIC Flows", the sum of the Treasury's data shows that foreign investors have invested about $75 billion a month over the last year, up from $55.6 billion in 2005 but less than the $81.6 billion in 2004. These flows omit direct investment and other banking and non-banking instruments, so they are not a complete balance of payments set, but they are strong indicators of investor interest in both US and international capital markets.
| Net Foreign Pur chases from US Residents, Bil $ | Sept 2006 | Aug 2006 | July 2006 | Monthly Average||||
|---|---|---|---|---|---|---|---|
| Last 12 Months | 2005 | 2004 | 2003 | ||||
| 1. Domestic Securities | 88.0 | 117.2 | 54.5 | 88.0 | 84.2 | 76.4 | 60.0 |
| Treasuries | -0.4 | 44.3 | 6.2 | 17.8 | 28.2 | 29.3 | 22.0 |
| Agencies | 26.0 | 31.4 | 18.6 | 23.4 | 18.3 | 18.9 | 13.0 |
| Corporate Bonds | 52.7 | 37.0 | 19.1 | 37.5 | 31.0 | 25.8 | 22.1 |
| Equities | 9.6 | 4.4 | 10.4 | 9.2 | 6.7 | 2.4 | 2.9 |
| 2. Foreign Securities | -22.9 | -2.7 | -21.8 | -15.2 | -14.4 | -12.7 | -4.7 |
| 3. "Other Acquisition"* | -11.9 | -11.1 | -14.5 | -12.0 | -11.7 | -3.2 | -11.6 |
| 4. Net Foreign Acquisition (1+2+3) | 53.2 | 103.3 | 18.3 | 60.8 | 58.2 | 60.4 | 43.7 |
| 5. Short-Term Liabilities | -10.8 | 9.6 | 29.7 | 9.2 | -3.9 | 15.8 | 1.3 |
| 6. Total TIC Flows** | 53.7 | 97.1 | 53.9 | 75.4 | 55.6 | 81.6 | 60.0 |

Tom Moeller
AuthorMore in Author Profile »Prior to joining Haver Analytics in 2000, Mr. Moeller worked as the Economist at Chancellor Capital Management from 1985 to 1999. There, he developed comprehensive economic forecasts and interpreted economic data for equity and fixed income portfolio managers. Also at Chancellor, Mr. Moeller worked as an equity analyst and was responsible for researching and rating companies in the economically sensitive automobile and housing industries for investment in Chancellor’s equity portfolio. Prior to joining Chancellor, Mr. Moeller was an Economist at Citibank from 1979 to 1984. He also analyzed pricing behavior in the metals industry for the Council on Wage and Price Stability in Washington, D.C. In 1999, Mr. Moeller received the award for most accurate forecast from the Forecasters' Club of New York. From 1990 to 1992 he was President of the New York Association for Business Economists. Mr. Moeller earned an M.B.A. in Finance from Fordham University, where he graduated in 1987. He holds a Bachelor of Arts in Economics from George Washington University.
More Economy in Brief


