 Global| Sep 13 2005
"Core" PPI Unchanged in August
by:Tom Moeller
|in:Economy in Brief
Summary
The producer price index for finished goods less food & energy, the so called "core" PPI, was unchanged last month versus Consensus expectations for a 0.1% increase and versus a 0.4% gain in July. The overall PPI rose 0.6% in August [...]
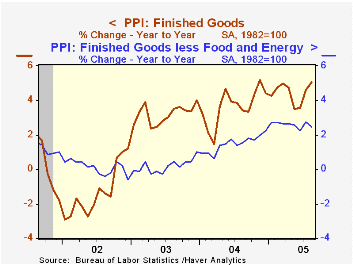
The producer price index for finished goods less food & energy, the so called "core" PPI, was unchanged last month versus Consensus expectations for a 0.1% increase and versus a 0.4% gain in July. The overall PPI rose 0.6% in August and that was below Consensus expectations for a 0.8% increase.
The core PPI is focused on since it provides an indication of the degree to which pressures on energy or food prices may be "spilling over."
Consumer durable goods prices fell 0.1% (+1.3% y/y) led by declines in passenger cars (+0.1% y/y) and appliances (+2.1% y/y). Core consumer nondurable goods prices rose 0.1% (3.7% y/y) while capital goods prices fell 0.1% (2.2% y/y).
Already, the pressure which lifted energy prices 3.7% (19.1% y/y) in August has begun to dissipate. The domestic spot market price of WTI crude oil yesterday fell to $63.35/bbl. from a daily high of $69.82 two weeks ago and an average $64.97 in August. Natural gas prices also have backed off 15% from the daily high but as of yesterday remained up 14% versus the August average.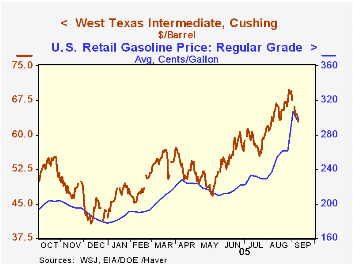
Intermediate goods prices again were strong and rose 0.7% due to a 3.3% rise in energy prices. Core intermediate goods prices, however, declined for the fourth consecutive month.
Crude prices also reflected the strength in energy prices, up 3.8% (28.8% y/y). Core crude prices also were strong for the second straight month reflecting a 22.8% (-26.9% y/y) jump in iron & steel scrap prices and higher prices for aluminum (8.8% y/y) and copper (49.5% y/y) scrap. During the last thirty years "core" crude prices have been a fair indicator of industrial sector activity with a 48% correlation between the six month change in core crude prices and the change in factory sector industrial production.
Hard "Core" Inflation from the Federal Reserve Bank of St. Louis is available here.
| Producer Price Index | Aug | July | Y/Y | 2004 | 2003 | 2002 |
|---|---|---|---|---|---|---|
| Finished Goods | 0.6% | 1.0% | 5.1% | 3.6% | 3.2% | -1.3% |
| Core | 0.0% | 0.4% | 2.5% | 1.5% | 0.2% | 0.1% |
| Intermediate Goods | 0.7% | 1.0% | 6.1% | 6.6% | 4.6% | -1.5% |
| Core | -0.1% | -0.1% | 3.2% | 5.7% | 2.0% | -0.5% |
| Crude Goods | 2.3% | 6.7% | 11.4% | 17.5% | 25.1% | -10.6% |
| Core | 4.6% | 3.1% | -0.1% | 26.6% | 12.4% | 3.8% |
by Tom Moeller September 13, 2005
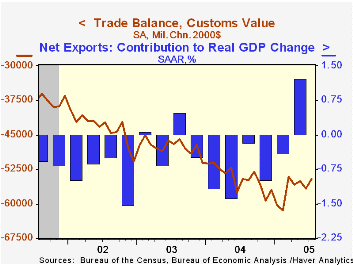
The U.S. foreign trade deficit narrowed to $57.9B in July versus the June deficit of $59.4 which was deeper than initially reported. Consensus expectations had been for a deficit of $59.7B. Despite the narrowing, the U.S. trade deficit remained in record territory with the average during the last three months a record $57.8B.
Adjusted for price inflation, the customs value of the U.S. trade deficit narrowed to $54.6B, the narrowest since March.
Total exports rose a paltry 0.4% following two months of having been roughly unchanged. The 0.5% (10.6% y/y) rise in goods exports last month was again held back by a decline in food, feeds & beverages which fell 2.8% (+9.0% y/y). Capital goods exports rose 0.6% (8.3% y/y) though exports of advanced technology products fell 10.2% (NSA, +8.6% y/y). Nonauto consumer goods exports rose 0.5% (13.0% y/y)
Services exports rose 0.1% (10.1% y/y) for the second month.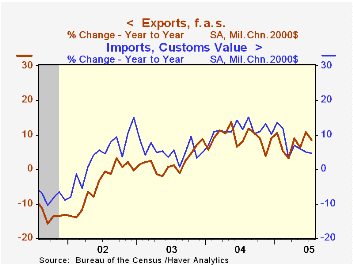
The 0.7% decline in imports of goods & services was due mostly to a 2.2% decline in capital goods (+9.5% y/y) and a 2.2% (+7.8% y/y) decline in nonauto consumer goods. Imports of petroleum products rose 5.2% (45.5% y/y) as the average price of crude oil rose to $49.03 per bbl. (46.9% y/y). Imports of non-petroleum goods fell 1.4% (+7.6% y/y).
The US trade deficit with China remained about stable at $17.7B ($161.9B in 2004) but the US trade deficit with Japan improved slightly to $6.6B ($75.6B in 2004). The monthly trade deficit with the Asian NICs also narrowed slightly to $1.2B ($21.9B in 2004) but the deficit with the European Union deepened to $11.2B ($109.3B in 2004).
A Look at China's New Exchange Rate Regime from the Federal Reserve Bank of San Francisco is available here.
Also from the San Francisco Fed, Understanding the Twin Deficits: New Approaches, New Results can be found here.
| Foreign Trade | July | June | Y/Y | 2004 | 2003 | 2002 |
|---|---|---|---|---|---|---|
| Trade Deficit | $57.9B | $59.5B | $51.3B (7/04) | $617.6B | $494.8B | $421.2B |
| Exports - Goods & Services | 0.4% | 0.1% | 10.4% | 12.6% | 4.6% | -3.0% |
| Imports - Goods & Services | -0.7% | 2.1% | 11.3% | 16.6% | 8.5% | 2.1% |
by Tom Moeller September 13, 2005
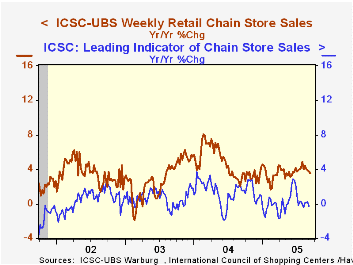
The International Council of Shopping Centers (ICSC)-UBS survey indicated that chain store sales fell 0.2% last week after no change the prior week. So far this month sales are 0.5% below the August average which fell 0.1% from July.
The ICSC indicated that at least 13 shopping malls were closed indefinitely be Hurricane Katrina.
During the last ten years there has been a 56% correlation between the y/y change in chain store sales and the change in non-auto retail sales less gasoline, as published by the US Census Department. Chain store sales correspond directly with roughly 14% of non-auto retail sales less gasoline. The leading indicator of chain store sales from ICSC rose 0.4% in the latest week (-0.3% y/y) following 0.2% declines during the prior two weeks.The ICSC-UBS retail chain-store sales index is constructed using the same-store sales (stores open for one year) reported by 78 stores of seven retailers: Dayton Hudson, Federated, Kmart, May, J.C. Penney, Sears and Wal-Mart.
| ICSC-UBS (SA, 1977=100) | 09/10/05 | 09/03/05 | Y/Y | 2004 | 2003 |
|---|---|---|---|---|---|
| Total Weekly Chain Store Sales | 454.6 | 455.4 | 3.5% | 4.6% | 2.9% |
by Tom Moeller September 13, 2005
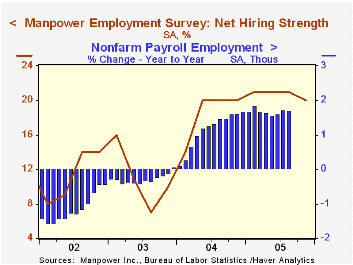
The Manpower Employment Outlook Survey for next quarter slipped to 20, down slightly from the average of 21 during the prior three quarters. The index indicates that a net 20% of 16,000 employers expect to increase hiring activity.
Since 1980 there has been a 74% correlation between the Manpower index and the y/y change in non-farm payrolls.
Not seasonally adjusted, 20% of employers planned to raise employment in 4Q04 while 8% planned to decrease employment.
The latest press release from Manpower Inc. covering global employment prospects can be viewed here.
| Manpower Employment Survey | 4Q '05 | 3Q '05 | 4Q '04 | 2004 | 2003 | 2002 |
|---|---|---|---|---|---|---|
| All Industries - Net Higher (SA) | 20 | 21 | 20 | 19 | 11 | 11 |
by Tom Moeller September 13, 2005
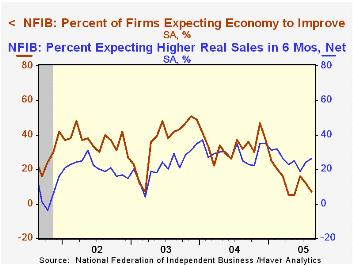
The National Federation of Independent Business (NFIB) reported that their index of optimism amongst small businesses fell 0.2% in August and reversed a small up tick the month prior.
During the last ten years there has been a 64% correlation between the level of the NFIB index and the two quarter change in real GDP.
A greater percentage of firms expected higher real sales in six months but a lower percentage expected the economy to improve.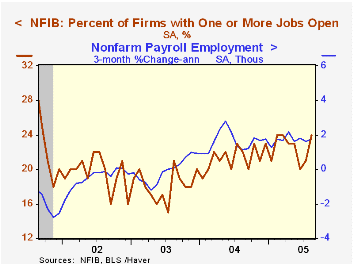
The percentage of firms with one or more job openings jumped back to the five year high of 24%. During the last ten years there has been a 67% correlation between hiring plans and the three month growth in nonfarm payrolls.
The percentage of firms planning to raise capital spending fell as did the percentage of firms raising average selling prices rose.
About 24 million businesses exist in the United States. Small business creates 80% of all new jobs in America.
| Nat'l Federation of Independent Business | Aug | July | Y/Y | 2004 | 2003 | 2002 |
|---|---|---|---|---|---|---|
| Small Business Optimism Index (1986=100) | 100.9 | 101.1 | -1.9% | 104.6 | 101.3 | 101.2 |
by Louise Curley September 13, 2005
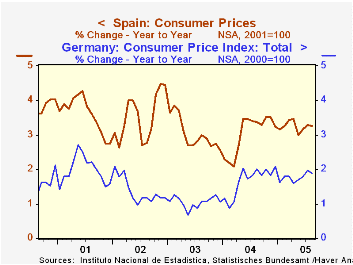
Inflation in Europe has remained surprisingly subdued in the face of sharply rising oil prices. However the data released today for three Euro Zone countries--France, Germany and Spain--and the United Kingdom suggest that this situation may be about to change. Although the August year-over-year percentage increases in consumer price indexes (the generally accepted definition of inflation) for Germany and Spain were lower than the July increases, those for the U. K. and France were significantly higher. Data for Germany and Spain are shown in the first chart and those for the U.K. and France in the second chart.
Of the four countries, the sharpest change has occurred in the U.K. Over that past five years, inflation in the UK showed little trend as it varied between 0.65% and 1.98% -- for the most part, well below the Bank of England's 2% inflation target rate. In late 2004, however, inflation began to rise sharply, and, for the last two months has been above the target rate, 2.3% in July and 2.4% in August. In spite of the July rise in inflation above its target rate, the Bank of England voted 5 to 4 to lower the base rate from 4.75% to 4.50% on August 4 to counteract slow growth. Should inflation continue above the target rate, further reductions in the base rate, even if growth remains sluggish, may now be less likely.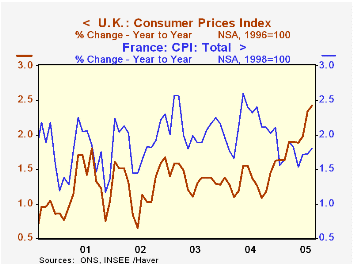
Among the countries in the Euro Zone, France is the other country, reporting today, to show some recent increase in the rate of inflation. Inflation in France had seemed to trending downward in the last part of 2004 but now shows some signs of reversing that trend. In contrast to France, inflation in Spain and Germany rose sharply in early 2004 and has since remained trend less at the higher level. In the face of sluggish growth in the Euro Zone, the European Central Bank has maintained its base rate at 2% since June, 2003. With the increased risk of higher inflation, slow growth would be unlikely to trigger a further decline in the base rate, while any indication of improved growth is very like to trigger an increase in the base rate.
Both France and Germany have had relatively low rates of inflation, while Spain has been among the high inflation group within the Euro Zone. As an indication of the relative position of the Euro Zone countries on the inflation scale, one can compare the level of the Harmonized Consumer Price Indexes which are comparable across countries and have the same base year,1996. For example, in 2004, the Harmonized Consumer Price Index for France averaged 113.3, that for Germany, 110.7, and for Spain, 124.1.
| Year-over-Year Percent Change in CPI Index | Aug 05 | Jul 05 | Aug 04 | M/M dif | Y/Y dif | 2004 | 2003 | 2002 |
|---|---|---|---|---|---|---|---|---|
| U. K. | 2.43 | 2.34 | 1.27 | 0.09 | 1.16 | 1.34 | 1.36 | 1.27 |
| France | 1.81 | 1.72 | 2.31 | 0.09 | -0.60 | 2.13 | 2.11 | 1.92 |
| Germany | 1.87 | 1.89 | 2.01 | -0.02 | -0.14 | 1.67 | 1.05 | 1.37 |
| Spain | 3.27 | 3.28 | 3.38 | -0.01 | -0.11 | 3.05 | 3.03 | 3.53 |

Tom Moeller
AuthorMore in Author Profile »Prior to joining Haver Analytics in 2000, Mr. Moeller worked as the Economist at Chancellor Capital Management from 1985 to 1999. There, he developed comprehensive economic forecasts and interpreted economic data for equity and fixed income portfolio managers. Also at Chancellor, Mr. Moeller worked as an equity analyst and was responsible for researching and rating companies in the economically sensitive automobile and housing industries for investment in Chancellor’s equity portfolio. Prior to joining Chancellor, Mr. Moeller was an Economist at Citibank from 1979 to 1984. He also analyzed pricing behavior in the metals industry for the Council on Wage and Price Stability in Washington, D.C. In 1999, Mr. Moeller received the award for most accurate forecast from the Forecasters' Club of New York. From 1990 to 1992 he was President of the New York Association for Business Economists. Mr. Moeller earned an M.B.A. in Finance from Fordham University, where he graduated in 1987. He holds a Bachelor of Arts in Economics from George Washington University.
More Economy in Brief


