 Global| Jul 19 2006
Core CPI Firmer Than Expected
by:Tom Moeller
|in:Economy in Brief
Summary
Consumer prices (CPI-U) rose an expected 0.2% during June. The 0.3% rise in prices less food & energy was, however, like the previous month firmer than expectations for a 0.2% gain. The upside surprise in "core" price inflation [...]
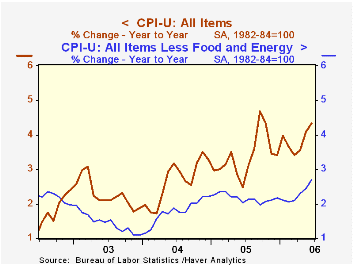
Consumer prices (CPI-U) rose an expected 0.2% during June. The 0.3% rise in prices less food & energy was, however, like the previous month firmer than expectations for a 0.2% gain.
The upside surprise in "core" price inflation represented the fourth consecutive month of 0.3% gain. It pulled the y/y gain in prices to 2.7%, the fastest since mid-2001.
Core goods prices rose 0.1% for the third consecutive month. While the resulting 0.5% y/y increase is modest, and indeed below a high 0.9% gain in early 2005, the rise contrasts with outright price deflation from 2002 to 2004.
Furniture & bedding costs rose 0.3% (2.0% y/y) in June to produce the strongest y/y increase in ten years. Apparel prices were unchanged last month (0.6% y/y) but here again the y/y gain was the firmest in two years. Appliance prices fell 0.3% (+0.7% y/y) while new & used motor vehicle prices ticked up 0.1% (0.1% y/y). Tobacco prices jumped 0.8% (4.8% y/y) and medical care commodity prices fell 0.1% (3.9% y/y).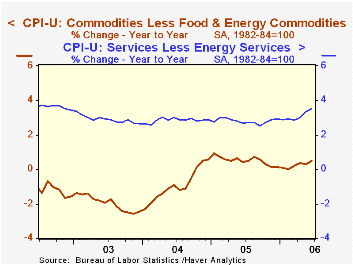
Core services prices rose 0.4% for the second consecutive month. Shelter prices again increased 0.4% (3.5% y/y) reflecting another strong 0.4% increase in the rental equivalence measure of owners' primary residences. The 3.6% y/y increase in this measure is the fastest since late 2002. Rents also increased 0.4% (3.5% y/y), an acceleration from the low of 2.5% in early 2004. Public transportation costs also have shown considerable strength and in June rose 1.2% to pull the y/y gain to 5.4%. Finally, education costs rose 0.5% for the fourth consecutive month (6.0% y/y) and medical care services prices rose 0.4% (4.2% y/y).
Food & beverage prices rose 0.3% helped by a 0.4% (0.4% y/y) rise in meat, fish & poultry prices. Fruit & vegetable prices soared 1.4% to lift the y/y increase to 4.0%.
Energy prices fell 0.9% due to a 1.0% decline in gasoline prices which has since reversed while natural gas & electricity prices fell 1.1% (+11.9% y/y).
The chained CPI, which adjusts for shifts in the mix of consumer purchases rose 0.3%. Less food & energy the increase in prices also was stable at 0.1%.
Is All That Talk Just Noise? from the Federal Reserve Bank of St. Louis is available here.
| Consumer Price Index | June | May | Y/Y | 2005 | 2004 | 2003 |
|---|---|---|---|---|---|---|
| Total | 0.2% | 0.4% | 4.3% | 3.4% | 2.7% | 2.3% |
| Total less Food & Energy | 0.3% | 0.3% | 2.7% | 2.2% | 1.8% | 1.5% |
| Goods less Food & Energy | 0.1% | 0.1% | 0.5% | 0.5% | -0.9% | -2.0% |
| Services less Energy | 0.4% | 0.4% | 3.5% | 2.8% | 2.8% | 2.9% |
| Energy | -0.9% | 2.4% | 23.2% | 16.9% | 10.8% | 12.2% |
| Food & Beverages | 0.3% | 0.2% | 2.3% | 2.4% | 3.4% | 2.1% |
| Chained CPI: Total (NSA) | 0.3% | 0.3% | 3.7% | 2.9% | 2.5% | 2.0% |
| Total less Food & Energy | 0.1% | 0.1% | 2.4% | 1.9% | 1.7% | 1.1% |
by Tom Moeller July 19, 2006
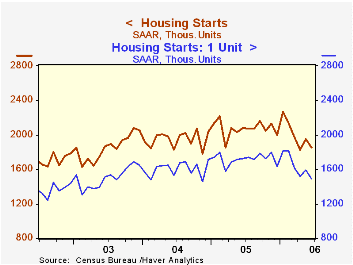
Housing starts fell 5.3% last month to 1.850M units, a decline that outpaced Consensus expectations for a lesser drop to 1.90M starts. For 2Q starts averaged 1.878M, down 11.5% from 1Q and it was the lowest quarterly level since mid 2003.
Total housing starts in June were 18.3% below the peak this past January.
Single-family starts fell 6.5% last month to 1.486M, a level which was 18.1% below the January peak. During 2Q single family starts fell 12.2% from the prior quarter.
Multi family starts rose a slight 0.3% in June but for 2Q fell 8.2%.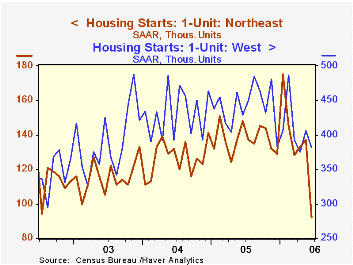
By region, single family housing starts were the weakest last month in the Northeast where starts plummeted by one third (-37.8% y/y) to the lowest level in ten years. In the South single family starts fell 5.5% (-11.2% y/y) and in the West single family starts fell 5.9% (-11.0% y/y). In the Midwest starts rose a modest 3.6% during June but were down 13.3% y/y.
Building permits fell for the fifth consecutive month and were down 16.9% from last year's peak.
Today's Semiannual Monetary Policy Report to the Congress by Chairman Ben S. Bernanke is available here.
| Housing Starts (000s, AR) | June | May | Y/Y | 2005 | 2004 | 2003 |
|---|---|---|---|---|---|---|
| Total | 1,850 | 1,953 | -11.0% | 2,073 | 1,950 | 1,854 |
| Single-family | 1,486 | 1,590 | -13.8% | 1,719 | 1,604 | 1,505 |
| Multi-family | 364 | 363 | 2.8% | 354 | 345 | 349 |
| Building Permits | 1,862 | 1,946 | -14.9% | 2,159 | 2,058 | 1,888 |
by Tom Moeller July 19, 2006
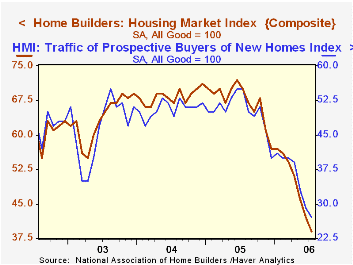
The July Composite Housing Market Index at 39 was at its lowest level since late 1991. The index compiled by the National Association of Home Builders (NAHB) fell from 42 in June and compared to Consensus expectations for a reading of 41.
During the last twenty years there has been a 75% correlation between the y/y change in the Composite Index and the change in single family housing starts.
The sub indexes covering current sales of single family homes (-43.4% y/y) and sales in the next six months (-40.3% y/y) were both down sharply m/m.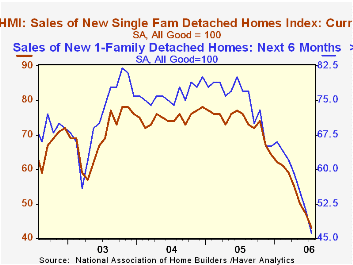
An index of the traffic of prospective home buyers fell even further from a dried up June level and was down 50.9% y/y.
Housing markets around the country were weak in July. The index for the Northeast off 47.8% y/y, in the Midwest the index fell 56.3% y/y, out West it was down 42.0% y/y and in the South it fell 32.4% y/y.
The NAHB index is a diffusion index based on a survey of builders. Readings above 50 signal that more builders view conditions as good than poor.
Visit the National Association of Home Builders.
| Nat'l Association of Home Builders | July | June | July '05 | 2005 | 2004 | 2003 |
|---|---|---|---|---|---|---|
| Composite Housing Market Index | 39 | 42 | 70 | 67 | 68 | 64 |
by Tom Moeller July 19, 2006
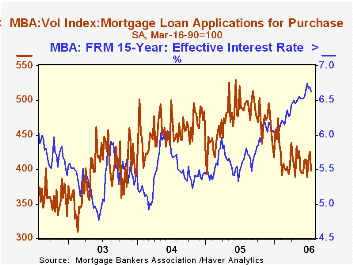
A 4.6% decline in the total number of mortgage applications last week reversed most of the increases during the prior two weeks and left applications early in July about even (+0.2%) with the June average which fell 1.5% from May.
Purchase applications fell a hard 6.2% w/w and left applications in July only 1.5% above the June average which fell 0.8% from May.
During the last ten years there has been a 58% correlation between the y/y change in purchase applications and the change in new plus existing single family home sales.
Applications to refinance fell 1.6% for the second week and the early July average was 2.2% below June. Refis during all of June fell 3.1% from the May average.
The effective interest rate on a conventional 30-year mortgage slipped w/w to 6.96% and the rate on 15-year financing also fell to 6.63%. Interest rates on 15 and 30 year mortgages are closely correlated (>90%) with the rate on 10 year Treasury securities.
During the last ten years there has been a (negative) 79% correlation between the level of applications for purchase and the effective interest rate on a 30-year mortgage.
The Mortgage Bankers Association surveys between 20 to 35 of the top lenders in the U.S. housing industry to derive its refinance, purchase and market indexes. The weekly survey accounts for more than 40% of all applications processed each week by mortgage lenders. Visit the Mortgage Bankers Association site here.
| MBA Mortgage Applications (3/16/90=100) | 07/14/06 | 07/07/06 | Y/Y | 2005 | 2004 | 2003 |
|---|---|---|---|---|---|---|
| Total Market Index | 540.8 | 566.8 | -32.5% | 708.6 | 735.1 | 1,067.9 |
| Purchase | 398.5 | 425.0 | -18.5% | 470.9 | 454.5 | 395.1 |
| Refinancing | 1,377.6 | 1,400.5 | -47.4% | 2,092.3 | 2,366.8 | 4,981.8 |
by Carol Stone July 19, 2006
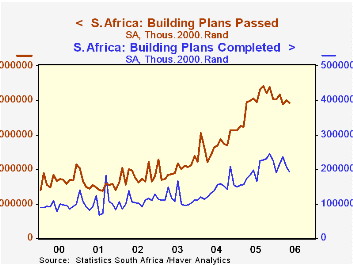
As the following charts and table illustrate, there's been something of a building boom in South Africa. Over the last few months, however, some areas of construction have been slowing.
Statistics South Africa reported today that total building plans passed declined in May to ZAR 3.92 billion from ZAR 4.00 billion in April (seasonally adjusted, 2000 prices. "ZAR" is the ISO code for the South African Rand). This amount is 3.2% below May 2005. This collection of data begins in 2000 and remains relatively erratic, so caution should be used in assessing just one month's figures. Indeed, Statistics South Africa highlights 3-month moving averages and year-to-date data in its press releases.
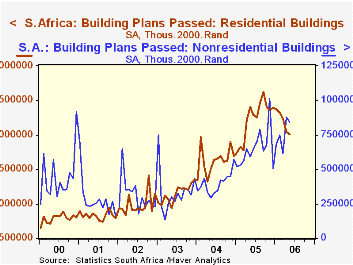 By type, there is an emerging downtrend in residential construction, while nonresidential building remains strong. Additions and alterations have been fairly steady. In the residential sector, small houses (under 80 square meters, about 861 square feet) are quite vigorous, with a 6-month moving average ending May up 70% from a year ago. Larger houses, though, are trailing off: in May the 6-month average was up 9.2% year-on-year, but a 3-month average was up only 4.1%.
Within the nonresidential sector, data are available not seasonally adjusted in nominal terms for offices, shopping centers, and industrial and warehouse structures. Perhaps in line with the residential sector's general slowing, shopping space construction plans have been flat now for about six months. Offices and banks, though, are still advancing, and industrial and warehousing facilities were up in May by nearly 63% from a year ago, based on 3-month average figures. This is large, but considerably more moderate than the 100%+ pace that characterized the latter part of 2005.
These are building "plans". With the recent surge in plans, many projects, especially nonresidential buildings will take some time for the construction. Thus, buildings completed, a separate measure, is much smaller than the plans figure. In May, a 3-month average of that total (seasonally adjusted) was ZAR 2.12 billion, up 23.9% from May 2005.
| South Africa: SA, Mil.2000.Rand |
May 2006 | Apr 2006 | Mar 2006 | Year Ago | Monthly Averages|||
|---|---|---|---|---|---|---|---|
| 2005 | 2004 | 2003 | |||||
| Building Plans Passed | 3925 | 4001 | 3886 | 3996 | 3912 | 2707 | 2013 |
| Residential | 2006 | 2048 | 2227 | 2403 | 2230 | 1624 | 1146 |
| Nonresidential | 847 | 881 | 613 | 591 | 651 | 395 | 334 |
| Additions & Alterations | 1072 | 1072 | 1046 | 1002 | 1031 | 688 | 533 |
| Buildings Completed | 1915 | 2064 | 2371 | 1884 | 1943 | 1417 | 1147 |

Tom Moeller
AuthorMore in Author Profile »Prior to joining Haver Analytics in 2000, Mr. Moeller worked as the Economist at Chancellor Capital Management from 1985 to 1999. There, he developed comprehensive economic forecasts and interpreted economic data for equity and fixed income portfolio managers. Also at Chancellor, Mr. Moeller worked as an equity analyst and was responsible for researching and rating companies in the economically sensitive automobile and housing industries for investment in Chancellor’s equity portfolio. Prior to joining Chancellor, Mr. Moeller was an Economist at Citibank from 1979 to 1984. He also analyzed pricing behavior in the metals industry for the Council on Wage and Price Stability in Washington, D.C. In 1999, Mr. Moeller received the award for most accurate forecast from the Forecasters' Club of New York. From 1990 to 1992 he was President of the New York Association for Business Economists. Mr. Moeller earned an M.B.A. in Finance from Fordham University, where he graduated in 1987. He holds a Bachelor of Arts in Economics from George Washington University.
More Economy in Brief


