 Global| Jan 16 2002
Consumer Prices Unchanged
by:Tom Moeller
|in:Economy in Brief
Summary
Consumer prices were weaker than expected last month, declining rather than remaining unchanged as expected. Core inflation at 0.1% was slightly below expectations for a 0.2% rise. Again, energy prices led the weakness in the CPI with [...]
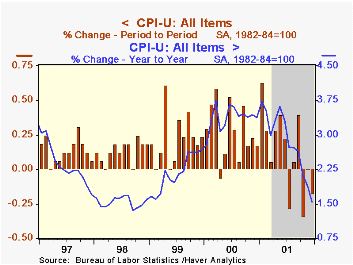
Consumer prices were weaker than expected last month, declining rather than remaining unchanged as expected. Core inflation at 0.1% was slightly below expectations for a 0.2% rise.
Again, energy prices led the weakness in the CPI with gasoline prices down 6.0% after two months of double-digit decline. Fuel oil prices fell 6.3% while piped gas and electricity prices fell 0.8%
Core goods prices were weak, falling due to a 3.4% decline in tobacco products prices and the second consecutive decline in apparel prices.
Food prices fell for the second consecutive month.
Services prices were relatively strong owing to the second consecutive 0.4% gain in shelter prices and strength in public transportation costs. Medical care, as well as education services, prices rose a modest 0.1% .
| Consumer Price Index | Dec '01 | Nov '01 | Y/Y | 2001 | 2000 | 1999 |
|---|---|---|---|---|---|---|
| Total | -0.2% | 0.0% | 1.5% | 2.8% | 3.4% | 2.2% |
| Total less Food & Energy | 0.1% | 0.4% | 2.8% | 2.7% | 2.4% | 2.1% |
| Goods less Food & Energy | -0.3% | 0.2% | -0.2% | 0.3% | 0.5% | 0.7% |
| Services less Energy | 0.3% | 0.5% | 3.9% | 3.7% | 3.3% | 2.7% |
| Energy | -3.2% | -4.4% | -13.1% | 3.7% | 16.9% | 3.6% |
| Food & Beverages | -0.1% | -0.1% | 2.8% | 3.1% | 2.3% | 2.1% |
by Tom Moeller January 16, 2002
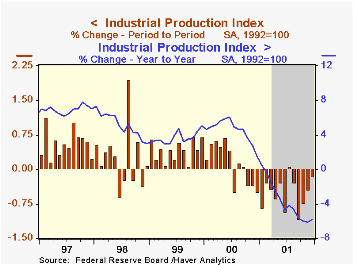
Industrial production fell slightly versus the expectation for no change last month. November's decline was deepened slightly.
Manufacturing output also fell a slight 0.1% (-5.9% y/y). Utility output rose slightly, but unseasonable warmth has reduced utility output 8.6% versus last year.
Output of consumer goods was unchanged after rising slightly in November. Output of business equipment was down for the fifteenth consecutive month.
Excluding high tech industries, total industry output fell 0.2% after falling 0.4% in November.Output of high tech products rose for the second month in three and November's sharp decline was lessened.
 |
| · Industrial production fell slightly versus the expectation for no change last month. November's decline was deepened slightly.· Manufacturing output also fell a slight 0.1% (-5.9% y/y). Utility output rose slightly, but unseasonable warmth has reduced utility output 8.6% versus last year.· Output of consumer goods was unchanged after rising slightly in November. Output of business equipment was down for the fifteenth consecutive month.· Excluding high tech industries, total industry output fell 0.2% after falling 0.4% in November. Output of high tech products rose for the second month in three and November's sharp decline was lessened. |
|---|
| Production & Capacity | Dec '01 | Nov '01 | Y/Y | 2001 | 2000 | 1999 |
|---|---|---|---|---|---|---|
| Industrial Production | -0.1% | -0.4% | -5.8% | -3.7% | 4.5% | 3.7% |
| Capacity Utilization | 74.4% | 74.5% | 80.2%(12/00) | 76.8% | 81.8% | 81.4% |
by Tom Moeller January 16, 2002
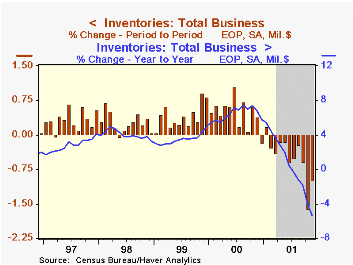
Total business inventories fell much more than expected in November. The decline in October inventories was deepened significantly due to a slightly lowered estimate of wholesale inventories and a sharply lowered estimate of manufacturing inventories.
Over the last three months, the pace of inventory liquidation (-12.0%, AR) has set a record for the twenty years of data availability.
Retail inventories fell across a number of categories, but the 2.2% decline in the apparel group was notable as it followed a 1.0% October drop.
Overall business sales fell 1.4% due to the weakness in retail sales which fell 3.4% due to the 10.3% plunge in auto sales.
The inventory-to-sales ratio was stable at 1.39, its lowest level since early last year.
| Business Inventories | Nov '01 | Oct '01 | Y/Y | 2000 | 1999 | 1998 |
|---|---|---|---|---|---|---|
| Total | -1.0% | -1.6% | -5.4% | 5.8% | 5.0% | 3.3% |
| Retail | -1.0% | -2.9% | -4.8% | 6.7% | 7.6% | 3.8% |
| Retail excl. Autos | -0.6% | -0.2% | -1.5% | 4.2% | 5.5% | 4.7% |
| Wholesale | -1.1% | -1.2% | -4.5% | 6.6% | 6.1% | 5.0% |
| Manufacturing | -0.9% | -0.7% | -6.4% | 4.6% | 2.3% | 1.9% |

Tom Moeller
AuthorMore in Author Profile »Prior to joining Haver Analytics in 2000, Mr. Moeller worked as the Economist at Chancellor Capital Management from 1985 to 1999. There, he developed comprehensive economic forecasts and interpreted economic data for equity and fixed income portfolio managers. Also at Chancellor, Mr. Moeller worked as an equity analyst and was responsible for researching and rating companies in the economically sensitive automobile and housing industries for investment in Chancellor’s equity portfolio. Prior to joining Chancellor, Mr. Moeller was an Economist at Citibank from 1979 to 1984. He also analyzed pricing behavior in the metals industry for the Council on Wage and Price Stability in Washington, D.C. In 1999, Mr. Moeller received the award for most accurate forecast from the Forecasters' Club of New York. From 1990 to 1992 he was President of the New York Association for Business Economists. Mr. Moeller earned an M.B.A. in Finance from Fordham University, where he graduated in 1987. He holds a Bachelor of Arts in Economics from George Washington University.
More Economy in Brief


