 Global| Apr 20 2006
Consumer Prices Remain Restrained through March in Europe & Canada
Summary
In March, consumer price inflation in Europe and North America eased or remained steady. Core inflation is also quiescent. For the Euro-Zone12, the total CPI was up just 2.2% from a year ago, less than in 2005 and 2004. The core rate, [...]
In March, consumer price inflation in Europe and North America eased or remained steady. Core inflation is also quiescent.
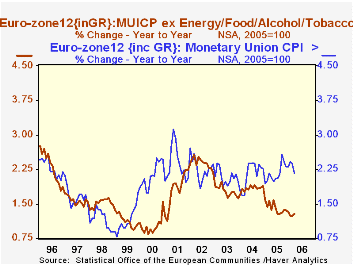
For the Euro-Zone12, the total CPI was up just 2.2% from a year ago, less than in 2005 and 2004. The core rate, which excludes food, energy, alcohol and tobacco, was a mere 1.3%; this is up very slightly from February and January, but equal to or lower than the last few years.
UK inflation is holding below 2.0% as March's figure eased 0.2% from February to 1.8%. Its core rate was also 0.2% lower, at 1.2% from 1.4% and for all of last year, 1.3%.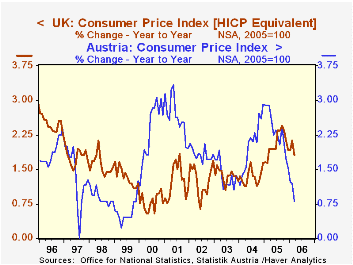
Incredibly, Austria's CPI has risen only 0.8% over the past year. In that country, health costs, transportation and communications, and education and recreation costs are all running slower; this is a fairly diverse group, indicating that no single factor is responsible for the slow pace.
Canada's CPI has been running just above a 2% trend for about three years. Its core, defined to exclude just food and energy, is edging a bit higher, but at 1.5% in March, is still quite temperate.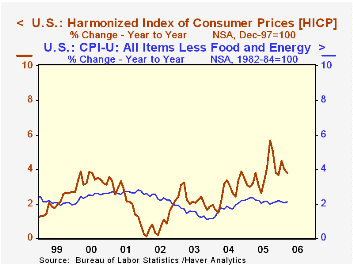
Finally, it is interesting to note that the high-inflation nation here is the US, with a year-on-year rate of 3.4% and the core at 2.1%. Yesterday, Tom Moeller described the month-to-month changes, which showed gains in a couple of categories coming off declines in February. Even so, the 12-month rate actually eased, similar to other countries, and the core rate was steady at 2.1% for a third straight month. Notably, the BLS has started to compile US CPI using the same structure as the Europeans, the so-called "harmonized index of consumer prices" or "HICP". On this basis, US inflation is higher still, at 3.7% in March, but it is no worse than 2005's similar number or 2004's 3.5%.
We continue to monitor these CPIs around the world for evidence that energy costs are pushing up other non-energy prices. So far, while it may "feel" to some of us, as consumers, that "things" are getting more expensive, the data everywhere show remarkable moderation in pricing of non-energy goods and services.
| NSA, Yr/Yr % Changes | Mar 2006 | Feb 2006 | Jan 2006 | December/December||||
|---|---|---|---|---|---|---|---|
| 2005 | 2004 | 2003 | 2002 | ||||
| Euro-Zone12 | 2.2 | 2.4 | 2.4 | 2.3 | 2.3 | 2.0 | 2.4 |
| Core* | 1.3 | 1.2 | 1.2 | 1.3 | 1.9 | 1.6 | 2.2 |
| UK | 1.8 | 2.0 | 1.9 | 1.9 | 1.7 | 1.3 | 1.7 |
| Core* | 1.2 | 1.4 | 1.2 | 1.3 | 1.3 | 0.9 | 1.8 |
| Austria | 0.8 | 1.2 | 1.2 | 1.5 | 2.9 | 1.3 | 1.8 |
| Canada | 2.2 | 2.2 | 2.8 | 2.2 | 2.1 | 2.0 | 3.9 |
| Core** | 1.5 | 1.4 | 1.4 | 1.3 | 1.4 | 1.0 | 3.9 |
| US | 3.4 | 3.6 | 4.0 | 3.4 | 3.3 | 1.9 | 2.4 |
| Core** | 2.1 | 2.1 | 2.1 | 2.2 | 2.2 | 1.1 | 1.9 |
| HICP | 3.7 | 4.0 | 4.5 | 3.7 | 3.5 | 1.8 | 2.2 |
Carol Stone, CBE
AuthorMore in Author Profile »Carol Stone, CBE came to Haver Analytics in 2003 following more than 35 years as a financial market economist at major Wall Street financial institutions, most especially Merrill Lynch and Nomura Securities. She had broad experience in analysis and forecasting of flow-of-funds accounts, the federal budget and Federal Reserve operations. At Nomura Securities, among other duties, she developed various indicator forecasting tools and edited a daily global publication produced in London and New York for readers in Tokyo. At Haver Analytics, Carol was a member of the Research Department, aiding database managers with research and documentation efforts, as well as posting commentary on select economic reports. In addition, she conducted Ways-of-the-World, a blog on economic issues for an Episcopal-Church-affiliated website, The Geranium Farm. During her career, Carol served as an officer of the Money Marketeers and the Downtown Economists Club. She had a PhD from NYU's Stern School of Business. She lived in Brooklyn, New York, and had a weekend home on Long Island.


