 Global| May 18 2005
Consumer Price Inflation Again Raised By Energy
by:Tom Moeller
|in:Economy in Brief
Summary
The CPI-U rose 0.6% in April due to a 4.5% jump in energy prices. Consensus expectations had been for a 0.4% rise in the total.Food prices also were strong posting a 0.7% advance, the strongest in nearly a year. Over the first four [...]
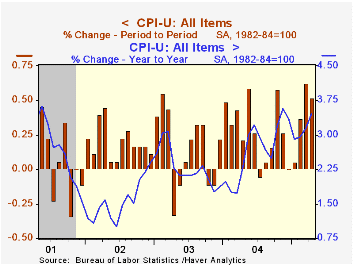
The CPI-U rose 0.6% in April due to a 4.5% jump in energy prices. Consensus expectations had been for a 0.4% rise in the total.Food prices also were strong posting a 0.7% advance, the strongest in nearly a year. Over the first four months of 2005 the CPI rose 4.8% at an annual rate.
Prices less food & energy were unchanged last month, the first unchanged monthly reading since 2003. During the first four months of this year the core CPI rose 2.6% at an annual rate. Consensus expectations had been for a 0.2% increase in April.
Core goods prices fell for the first month since last August. Apparel prices reversed much of the prior month's strength with a 0.6% decline (-0.5% y/y). Home furnishings & operation prices were unchanged for the second consecutive month due to a 1.5% (-0.8% y/y) drop in prices of window & wall coverings. Appliance prices (-0.1% y/y) and furniture prices (-0.6% y/y) also are down year to year. New & used motor vehicle prices were unchanged (+1.6% y/y).
Services price inflation eased. Less energy, the 0.2% increase was the weakest since January. Shelter prices were unchanged (2.7% y/y) following a 0.6% pop in March while the gain in medical care services prices halved to 0.3% (5.0% y/y). Public transportation prices were strong for the second consecutive month, up 1.7% (1.7% y/y), and school tuition rose another 0.6% (6.5% y/y).
Energy prices added to the prior month's increase. The 4.5% increase was pumped by a 6.4% (24.3% y/y) rise in gasoline prices, a 4.8% (33.4% y/y) jump in fuel oil prices and a 2.3% (8.1% y/y) surge natural gas & electricity prices. In May gasoline prices have fallen to an average $2.20 per gallon ($2.16 in the latest week) versus $2.24 averaged in April.
Food prices jumped 0.7% due to a 3.4% (5.2% y/y) recovery in fruit & vegetable prices following four months of decline. Beverage prices also were strong for the second month, up 1.1% (3.6% y/y) and prices of meat, poultry & fish prices doubled the 0.2% March increase (3.1% y/y).
The chained CPI which adjusts for shifts in the mix of consumer purchases rose 0.5%. Core chain prices eased, however, to 0.2%.
A Walk Around the World Economy, remarks by Richard W. Fisher, President and Chief Financial Officer of the Federal Reserve Bank of Dallas are available here.
| Consumer Price Index | April | March | Y/Y | 2004 | 2003 | 2002 |
|---|---|---|---|---|---|---|
| Total | 0.5% | 0.6% | 3.5% | 2.7% | 2.3% | 1.6% |
| Total less Food & Energy | 0.0% | 0.4% | 2.2% | 1.8% | 1.5% | 2.3% |
| Goods less Food & Energy | -0.1% | 0.0% | 0.5% | -0.9% | -2.0% | -1.1% |
| Services less Energy | 0.2% | 0.5% | 2.9% | 2.8% | 2.9% | 3.8% |
| Energy | 4.5% | 4.0% | 16.9% | 10.9% | 12.2% | -5.9% |
| Food | 0.7% | 0.2% | 3.1% | 3.4% | 2.1% | 1.8% |
| Chained CPI: Total (NSA) | 0.5% | 0.7% | 2.9% | 2.3% | 2.0% | 1.3% |
| Total less Food & Energy | 0.2% | 0.5% | 1.9% | 1.5% | 1.1% | 1.9% |
by Tom Moeller May 18, 2005
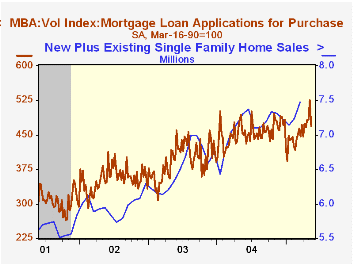
Total mortgage applications dropped 10.5% last week and reversed more than all of the prior week's increase according to the Mortgage Bankers Association. Nevertheless, applications so far in May are 8.0% ahead of the April average.
Applications to purchase a home slumped 10.8% w/w but in May are 5.8% ahead of April. During the last ten years there has been a 50% correlation between the y/y change in purchase applications and the change in new plus existing single family home sales.
Applications to refinance fell 10.0% w/w but are 11.0% higher than in April.
The effective interest rate on a conventional 30-year mortgage fell back below 6.0% to 5.97%. The effective rate on a 15-year mortgage was 5.59%.
The Mortgage Bankers Association surveys between 20 to 35 of the top lenders in the U.S. housing industry to derive its refinance, purchase and market indexes. The weekly survey accounts for more than 40% of all applications processed each week by mortgage lenders. Visit the Mortgage Bankers Association site here.
Credit Risk Management Guidance for Home Equity Lending from the Federal Reserve Board and other agencies is available here.
| MBA Mortgage Applications (3/16/90=100) | 05/13/05 | 05/06/05 | Y/Y | 2004 | 2003 | 2002 |
|---|---|---|---|---|---|---|
| Total Market Index | 699.2 | 781.0 | 6.9% | 735.1 | 1,067.9 | 799.7 |
| Purchase | 469.3 | 526.2 | 3.3% | 454.5 | 395.1 | 354.7 |
| Refinancing | 2,036.7 | 2,263.3 | 12.1% | 2,366.8 | 4,981.8 | 3,388.0 |
by Carol Stone May 18, 2005
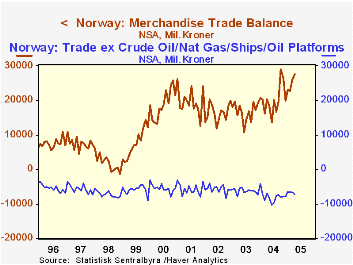
Perhaps it goes without saying that energy production is a major part of the Norwegian economy. But balance of trade data, which were reported today for April, underscore that fact dramatically. The total balance of trade is seen to be a surplus of NKr27.6 billion in April, up from March's NKr25.9 billion and a monthly average of NKr20.1 billion. The petroleum sector more than accounts for the surplus, as apart from it, the trade accounts run deficits, the latest at NKr7.3 billion. The energy sector exports were NKr22.0 billion in April, a little more than 61% of total exports.
"Energy sector" is a term we apply to the Central Statistics Bureau's listing of "crude oil, natural gas, ships and oil platforms". Norway is unusual among oil exporting nations in also constructing the transportation equipment and the water-borne drilling rigs. In April, these exports were a mere NKr28 million, but when even a single rig or ship is delivered, these exports can spike to NKr2 or 3 billion.
The price of energy, of course, also plays a major role in the reported amount of energy-related exports and thence the overall trade surplus. In the second chart, the close comparison is readily apparent. There, we used the balance of trade converted to US$, plotted with the price of Brent crude. The correlation is a very tight 91%. The correlation with the balance expressed in Kroner is still 84%.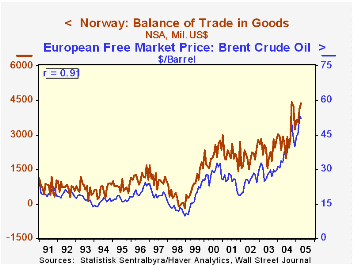
Data for Norway are included in Haver's "NORDIC" and "G10" databases. Conversions to US dollars and some seasonal adjustment is performed in the series contained in G10/Norway.
| Norway Millions NKr |
Apr 2005 | Mar 2005 | Apr 2004 | Monthly Averages|||
|---|---|---|---|---|---|---|
| 2004 | 2003 | 2002 | ||||
| Trade Balance | 27,605 | 25,943 | 20,326 | 20,133 | 16,639 | 16,377 |
| ex Energy Sector* | -7,264 | -6,632 | -6,771 | -7,876 | -6,314 | -5,751 |
| Exports | 57,081 | 54,166 | 44,956 | 47,298 | 40,245 | 39,413 |
| ex Energy Sector* | 22,045 | 21,433 | 17,816 | 18,809 | 16,800 | 16,663 |
| Kroner/US$ | 6.3199 | 6.1972 | 6.9242 | 6.7412 | 7.0800 | 7.9839 |

Tom Moeller
AuthorMore in Author Profile »Prior to joining Haver Analytics in 2000, Mr. Moeller worked as the Economist at Chancellor Capital Management from 1985 to 1999. There, he developed comprehensive economic forecasts and interpreted economic data for equity and fixed income portfolio managers. Also at Chancellor, Mr. Moeller worked as an equity analyst and was responsible for researching and rating companies in the economically sensitive automobile and housing industries for investment in Chancellor’s equity portfolio. Prior to joining Chancellor, Mr. Moeller was an Economist at Citibank from 1979 to 1984. He also analyzed pricing behavior in the metals industry for the Council on Wage and Price Stability in Washington, D.C. In 1999, Mr. Moeller received the award for most accurate forecast from the Forecasters' Club of New York. From 1990 to 1992 he was President of the New York Association for Business Economists. Mr. Moeller earned an M.B.A. in Finance from Fordham University, where he graduated in 1987. He holds a Bachelor of Arts in Economics from George Washington University.
More Economy in Brief


