 Global| Jun 17 2003
Consumer Price Index Flat, Core Boosted by Higher Services Prices
by:Tom Moeller
|in:Economy in Brief
Summary
The Consumer Price Index (CPI-U) was unchanged last month following a 0.3% drop in April. Consensus expectations had been for a 0.1% decline. Higher prices for most services offset continued price declines for energy and goods. The [...]

The Consumer Price Index (CPI-U) was unchanged last month following a 0.3% drop in April. Consensus expectations had been for a 0.1% decline. Higher prices for most services offset continued price declines for energy and goods.
The CPI less food and energy rose 0.3% last month versus Consensus expectations for a 0.1% rise. It was the strongest m/m gain in core prices since August 2002.
Core services prices led the strength in pricing power last month following three months of little change. So far this year these prices are up 2.6% (AR). Shelter prices rose 0.6% in May (2.3% YTD AR) following three months of no change. Medical care services prices rose 0.5% (2.7% YTD AR).Education and communication prices fell for the third consecutive month. Public transportation prices jumped 2.0% higher (4.5% YTD AR).
Offsetting the strength in services was continued deflation in energy prices which fell 3.1% in May for the second sharp monthly drop. Gasoline prices fell 6.8% but so far in June are flat to up slightly versus May. Fuel oil prices fell 5.6% (28.2% YTD AR). Piped gas & electricity prices rose 0.5% (21.2% YTD AR).
Goods prices continued to deflate. Apparel prices fell 0.3%, down 5.6% YTD AR. New and used vehicle prices fell 0.2%, down 2.2% YTD AR. Prices for household furnishings and operation fell 0.5% (-2.1% YTD AR).
The chained CPI which adjusts for shifts in consumer buying behavior fell 0.2% for the second month. It is similar to the PCE price deflator. The core price measure was unchanged for the second month (1.8% YTD AR).
Analysis by the Federal Reserve Bank of New York titled "Social Security and the Consumer Price Index for the Elderly" can be found here.
| Consumer Price Index | May | April | Y/Y | 2002 | 2001 | 2000 |
|---|---|---|---|---|---|---|
| Total | 0.0% | -0.3% | 2.1% | 1.6% | 2.8% | 3.4% |
| Total less Food & Energy | 0.3% | 0.0% | 1.6% | 2.3% | 2.7% | 2.4% |
| Goods less Food & Energy | -0.4% | -0.3% | -1.9% | -1.1% | 0.3% | 0.5% |
| Services less Energy | 0.5% | 0.1% | 3.0% | 3.8% | 3.7% | 3.3% |
| Energy | -3.1% | -4.6% | 9.2% | -5.8% | 3.7% | 16.9% |
| Food & Beverages | 0.3% | -0.1% | 1.7% | 1.8% | 3.1% | 2.3% |
| Chained CPI: Total (NSA) | -0.2% | -0.2% | 1.6% | 1.3% | 2.3% | 2.0% |
| Total less Food & Energy | 0.0% | 0.0% | 1.0% | 1.8% | 2.0% | 1.4% |
by Tom Moeller June 17, 2003
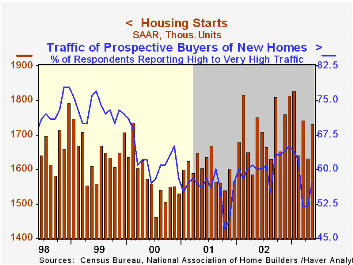
Housing starts rose about as expected last month and recovered just about all of the prior month's decline. Total starts of 1.73 mil. units were up 6.1% from April which was little revised. Consensus expectations had been for starts of 1.70 mil.
Single family starts rose 1.5% m/m following a 2.5% April decline. So far this year single family starts are up 1.9% from the 2002 average.
Multi-family starts showed strength last month and rose 29.2%, reversing all of the prior month's drop. Multi-family starts this year are down 6.3% versus 2002.
Building permits added 3.7% in May to the 2.1% gain in April. Single family permits rose just a bit but multi family permits were strong.
| Housing Starts (000s, AR) | May | April | Y/Y | 2002 | 2001 | 2000 |
|---|---|---|---|---|---|---|
| Total | 1,732 | 1,632 | -1.1% | 1,711 | 1,601 | 1,573 |
| Single Family | 1,378 | 1,358 | -0.8% | 1,364 | 1,272 | 1,232 |
| Multi Family | 354 | 274 | -2.5% | 347 | 330 | 341 |
| Building Permits | 1,788 | 1,724 | 3.9% | 1,750 | 1,637 | 1,598 |
by Tom Moeller June 17, 2003

Industrial production rose a slight 0.1% in May following two months of 0.6% decline (revised down). Consensus expectations for no change.
Output in the manufacturing sector rose 0.2% (-1.0% y/y) for the first monthly gain since January.
Output in selected high-technology industries rose 0.8% (8.5% y/y) for the fifth consecutive monthly gain. Excluding high-tech factory output rose 0.2% (-1.7% y/y) in May. Motor vehicle output fell sharply for the fourth straight month but electrical equipment and nondurable factory output rose.
Total capacity utilization was unchanged at 74.3%, the lowest level since July 1983. Factory sector utilization rose slightly to 72.6%. Growth in capacity slowed to 1.0% y/y versus 1.5% growth last year and 3.2% growth in 2001.
| Production & Capacity | May | April | Y/Y | 2002 | 2001 | 2000 |
|---|---|---|---|---|---|---|
| Industrial Production | 0.1% | -0.6% | -0.7% | -0.8% | -3.5% | 4.7% |
| Capacity Utilization | 74.3% | 74.3% | 75.7%(5/02) | 75.6% | 77.3% | 82.7% |
by Tom Moeller June 17, 2003

Chain store sales rose 0.3% last week and recovered all of the prior week's decline according to the BTM-UBSW survey.
Sales so far in June sales are 0.1% below the May average.
During the last five years there has been a 59% correlation between the year-to-year percent change in chain store sales and the change in nonauto retail sales less gasoline.
The BTM leading indicator of chain store sales was unchanged following strong gains through most of May.
The BTM-UBSW retail chain-store sales index is constructed from the sales results reported by seven retailers: Dayton Hudson, Federated, Kmart, May, J.C. Penney, Sears and Wal-Mart.
| BTM-UBSW (SA, 1977=100) | 6/14/03 | 6/07/03 | Y/Y | 2002 | 2001 | 2000 |
|---|---|---|---|---|---|---|
| Total Weekly Retail Chain Store Sales | 417.0 | 415.8 | 0.6% | 3.6% | 2.1% | 3.4% |
by Tom Moeller June 17, 2003

The Manpower employment survey for 3Q indicated that across industries, a seasonally adjusted net 6% of 16,000 employers expect to increase hiring activity.
The latest reading is down from 11% in 2Q and was the lowest since 2Q 1991.
Since 1980 there has been a 74% correlation between the Manpower index and the y/y change in nonfarm payrolls.
The latest press release from Manpower Inc. covering employment prospects in 18 countries can be viewed here.
| Manpower Employment Survey | 3Q03 | 2Q03 | 3Q02 | 2002 | 2001 | 2000 |
|---|---|---|---|---|---|---|
| All Industries - Net Higher (SA) | 6 | 11 | 14 | 11 | 17 | 24 |

Tom Moeller
AuthorMore in Author Profile »Prior to joining Haver Analytics in 2000, Mr. Moeller worked as the Economist at Chancellor Capital Management from 1985 to 1999. There, he developed comprehensive economic forecasts and interpreted economic data for equity and fixed income portfolio managers. Also at Chancellor, Mr. Moeller worked as an equity analyst and was responsible for researching and rating companies in the economically sensitive automobile and housing industries for investment in Chancellor’s equity portfolio. Prior to joining Chancellor, Mr. Moeller was an Economist at Citibank from 1979 to 1984. He also analyzed pricing behavior in the metals industry for the Council on Wage and Price Stability in Washington, D.C. In 1999, Mr. Moeller received the award for most accurate forecast from the Forecasters' Club of New York. From 1990 to 1992 he was President of the New York Association for Business Economists. Mr. Moeller earned an M.B.A. in Finance from Fordham University, where he graduated in 1987. He holds a Bachelor of Arts in Economics from George Washington University.
More Economy in Brief


