 Global| Jan 27 2009
Consumer Confidence Fell To ARecord Low
by:Tom Moeller
|in:Economy in Brief
Summary
The Conference Board reported that its December index of consumer confidence fell to a record low last month. The drop to a level of 38.0 followed a November uptick and it lowered Confidence by more than one-half from its year ago [...]
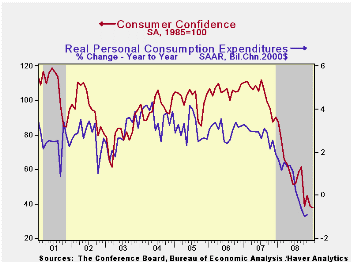
The Conference Board reported that its December index of consumer confidence fell to a record low last month. The drop to a level of 38.0 followed a November uptick and it lowered Confidence by more than one-half from its year ago level. The December decline about matched Consensus expectations.
During the last ten years there has been an 82% correlation between the level of consumer confidence and the y/y change in real consumer spending.
The present conditions index fell by nearly one-third from the
November level, off by three-quarters during the year. Jobs were seen
as hard to get by 42.0% of respondents, the highest since 1992 and jobs
were seen as plentiful by only 6.2%. Business conditions were seen as
good by just 7.7%, the lowest since 1991. Those who thought conditions
were bad rose to 46.0%, also the highest since 1992.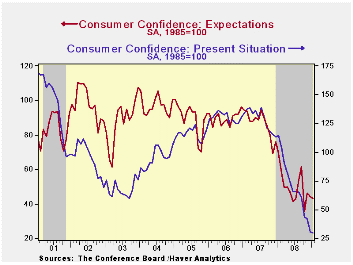
And the economic outlook was dire as indicated by another decline in the expectations index. The percentage of respondents expecting business conditions to worsen in six months rose to 32.8%, near the highest since the credit crunch of 1980. A modest 12.4% expected improvement in conditions. More jobs were expected by just 9.9% of respondents while a near-record 19.1% foresaw less income.
Expectations for the inflation rate in twelve months fell further 5.8%, the lowest level since February.
The decline in confidence around the country was fairly uniform and varied little by income level.
The Economic Outlook and Some Challenges Facing the Federal Reserve is a speech made by Philadelphia Fed President Charles I. Plosser and it can be found here.
| Conference Board (SA, 1985=100) | December | November | Y/Y % | 2008 | 2007 | 2006 |
|---|---|---|---|---|---|---|
| Consumer Confidence Index | 38.0 | 44.7 | -58.1 | 57.9 | 103.4 | 105.9 |
| Present Situation | 29.4 | 42.3 | -74.0 | 69.4 | 128.8 | 130.2 |
| Expectations | 43.8 | 46.2 | -42.2 | 49.9 | 86.4 | 89.7 |
Case-Shiller Home Price Index Fell A Record 18.2%
by Tom Moeller January 27, 2009
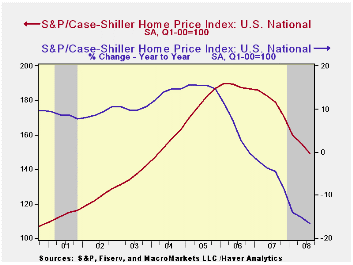
The S&P/Case-Shiller 20 Home Price Composite Index fell another 1.9% during November. That pulled prices down 18.2% during the last twelve months and by 25.2% since their peak in May 2006. The series dates back only to 2000. The decline in November prices was as expected.
The Case-Shiller index of 20 U.S. cities and their surrounding areas is weighted to reflect price changes due to extensive remodeling, home additions or extreme neglect. For example, smaller weights are assigned to sales of homes that have undergone extensive remodeling.
The Case-Shiller composite index of homes in 10 metropolitan areas, which has a longer history and dates back to 1987, fell 1.8% during November. It was down 19.1% year-to-year and down 26.8% since the 2006 peak.
Weakest Regions: Home prices in Phoenix, Nevada continued quite weak and fell 3.1% during November (-32.9% y/y) and in San Diego prices fell another 1.8% (-25.8% y/y). Prices here were off 38.2% from their early 2006 peak. Home prices in Las Vegas, Nevada fell 2.7% (-31.7% y/y) and were down 41.7% from their peak. Prices in Miami fell 2.1% (-28.7% y/y) during November while the weakness in home prices in Los Angeles where prices fell 1.7% (-26.9% y/y. In San Francisco home prices were off 30.8% year-to-year, off 38.04 from their 2006 peak, while prices in Miami fell 28.7% y/y. Florida generally has seen weak home prices. In Tampa they fell 20.9% y/y and in Detroit home prices fell by 20.7% y/y off 34.6% from the peak.
Less Weak Regions: In the Northeast, the decline in home prices continued less severe. In New York, prices fell 8.6% y/y, off 13.8% from their 2006 peak. Prices were down 7.3% year-to-year in Boston. In Dallas prices also were off by a modest 3.3% y/y and by 5.6% from last year's peak. In Charlotte, North Carolina they fell a somewhat greater 5.3% y/y and in Denver, home prices were off 4.3% y/y. In Cleveland Ohio prices were off 5.2% y/y and in Chicago, home prices were down a relatively heafty 12.5% y/y, 16.1% from the peak.
The S&P/Case-Shiller home price series can be found in Haver's USECON database but the city data is in the REGIONAL database.
The latest press release from Standard & Poor's can be found here.
An overview of the S&P/Case-Shiller home price series can be found here.
| S&P/Case-Shiller Home Price Index (NSA, Jan 00 = 100) | November | October | Y/Y | 2007 | 2006 | 2005 |
|---|---|---|---|---|---|---|
| 20 City Composite Index | 154.18 | 157.17 | -18.2% | -3.8% | 7.6% | 15.8% |
U.S. Gasoline Price Rise Stabilized
by Tom Moeller January 27, 2009
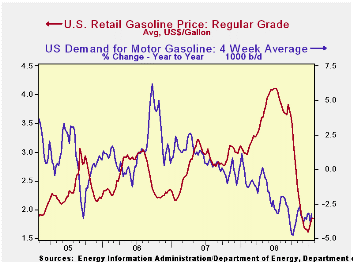
The recent rise in regular gasoline prices stabilized last week after three consecutive weeks of increase. At an average $1.84 per gallon prices about matched the prior week's level but that still was up 13 cents from the recent low, according to the U.S. Department of Energy survey. The latest level was near the highest price since late November. Yesterday, the spot market price for regular gasoline held stable with Friday's level of $1.17 per gallon which also was the average during last week.
Weekly gasoline prices can be found in Haver's WEEKLY
database. Daily prices are in the DAILY
database.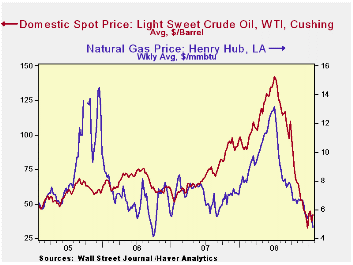
Demand continued quite weak for gasoline in reaction to the economy's weakness. The U.S. Department of Energy reported that the demand for gasoline fell by 3.2% during the latest four weeks. While the rate of decline remained nearly the fastest since late-1995 (the latest four weeks versus the same four weeks in 2008) it has been stable since November. The demand for all petroleum products also has been down a sharp 4.7% y/y. These numbers are available in Haver's OILWKLY database.
The source for that reduced demand for gasoline is the cutback in vehicle miles driven which have fallen 5.3% year-to-year during the twelve months ended November. The rate of decline has been accelerating since late 2007 and it is nearly unprecedented. These Department of Transportation figures are available in Haver's OGJ database.
The price for a barrel of West Texas Intermediate crude moved back up last week to $42.18 per barrel. Prices reached their high of $145.66 last July. In futures trading yesterday, the one-month price for crude oil moved higher versus last week to $45.73 per barrel. The two month futures price was higher still at $48.49.
The price of natural gas slipped further to $4.80 per mmbtu (-39.1% y/y). The latest average price was almost 50% below natural gas prices in early-July of $13.19/mmbtu.
Bagehot on the Financial Crisis of 1825...and 2008 from the Federal Reserve Bank of St. Louis can be found here.
The Fed's Response To The Credit Crunch, also from the Federal Reserve Bank of St. Louis is available here.
| Weekly Prices | 01/26/09 | 01/19/09 | Y/Y | 2008 | 2007 | 2006 |
|---|---|---|---|---|---|---|
| Retail Regular Gasoline ($ per Gallon) | 1.84 | 1.85 | -38.3% | 3.25 | 2.80 | 2.57 |
| Light Sweet Crude Oil, WTI ($ per bbl.) | 42.18 | 36.91 | -52.8% | 100.16 | 72.25 | 66.12 |
U.S. Chain Store Sales Fell Back; 2.4% Yearly Decline a Record
by Tom Moeller January 27, 2009
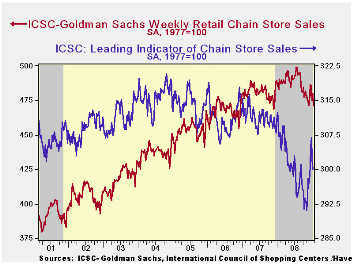
Chain store sales last week retraced the prior week's increase, and more, with a 1.8% decline, according to the International Council of Shopping Centers-Goldman Sachs Index. The drop followed the prior week's 1.1% increase and it left sales in January about even with the December average. The year-to year change of -2.4% stands as the weakest in the series' history which extends back to 1990.
The ICSC-Goldman Sachs retail chain-store sales index is constructed using the same-store sales (stores open for one year) reported by 78 stores of seven retailers: Dayton Hudson, Federated, Kmart, May, J.C. Penney, Sears and Wal-Mart.
During the last ten years there has been a 64% correlation between the year-to-year growth in chain store sales and the growth in general merchandise sales.
The outlook for sales weakened recently. The weekly leading indicator of chain store sales from ICSC-Goldman Sachs fell 0.7% after a 1.6% decline during the prior week. The average level so far in January is up 1.0% from December, which rose 2.1% versus November. Since the lows of one month ago the index has recovered 3.1%.
The chain store sales figures are available in Haver's SURVEYW database.
| ICSC-UBS (SA, 1977=100) | 01/24/09 | 01/17/09 | Y/Y | 2008 | 2007 | 2006 |
|---|---|---|---|---|---|---|
| Total Weekly Chain Store Sales | 471.0 | 479.8 | -2.4% | 1.4% | 2.8% | 3.3% |
German Biz Confidence In a Small Rebound: What's All the Fuss?
by Robert Brusca January 27, 2009
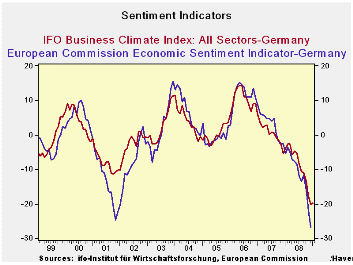
The German IFO index made a small rebound in January and that
has caused some excited stirring in markets. Still the IFO Business
climate index is very weak and the EMU sentiment index for Germany
(Dec) is even lower than it was in 2001 at the bottom. There should be
little excitement is such low persisting readings and on such a weak
rebound.
The table above shows that the Biz Climate, Current Situation
and Biz Expectations indices all are down about 20% Yr/Yr. Taken as a
percent of their respective ranges since early 1991 the business
climate index is in at the bottom one-percentile of its range, the
current situation is in the bottom 12% of its range and business
expectations are in the bottom nine percent of their range. These are
all weak global range positions and year over year standings.
That markets want to put a positive spin on such a poor
showing tells us of the poor state of market psychology right now.
Clearly the chart (above) shows little to cheer about. In any event we
would expect a much more substantial rebound in expectations even
before the current situation improves. Nothing like that is in train.
The optimism registered today, is just that based on nothing in
particular.
| IFO Survey: Germany | |||||||||
|---|---|---|---|---|---|---|---|---|---|
| Percent: Yr/Yr | Index Numbers | ||||||||
| Jan 09 |
Dec 08 |
Nov 08 |
Oct 08 |
Sep 08 |
Current | Dec 08 |
Curr/ Avg |
Percentile | |
| Biz Climate | -19.8% | -20.0% | -17.8% | -13.4% | -11.0% | 83.0 | 82.7 | 86.3% | 1.1% |
| Current Situation | -19.8% | -18.1% | -14.2% | -8.9% | -9.4% | 86.8 | 88.8 | 90.3% | 11.9% |
| Biz Expectations | -19.8% | -21.9% | -21.3% | -17.6% | -12.6% | 79.4 | 76.9 | 82.4% | 8.7% |
| average & range since Apr-91 | |||||||||

Tom Moeller
AuthorMore in Author Profile »Prior to joining Haver Analytics in 2000, Mr. Moeller worked as the Economist at Chancellor Capital Management from 1985 to 1999. There, he developed comprehensive economic forecasts and interpreted economic data for equity and fixed income portfolio managers. Also at Chancellor, Mr. Moeller worked as an equity analyst and was responsible for researching and rating companies in the economically sensitive automobile and housing industries for investment in Chancellor’s equity portfolio. Prior to joining Chancellor, Mr. Moeller was an Economist at Citibank from 1979 to 1984. He also analyzed pricing behavior in the metals industry for the Council on Wage and Price Stability in Washington, D.C. In 1999, Mr. Moeller received the award for most accurate forecast from the Forecasters' Club of New York. From 1990 to 1992 he was President of the New York Association for Business Economists. Mr. Moeller earned an M.B.A. in Finance from Fordham University, where he graduated in 1987. He holds a Bachelor of Arts in Economics from George Washington University.


