 Global| Nov 12 2007
Commodity Prices: Oil Up, Most Other Inflation Forces Topped
by:Tom Moeller
|in:Economy in Brief
Summary
The headline commodity price worry is the rise in oil and energy prices: 57.2% for WTI and 28.7% for gasoline since the beginning of the year. And gasoline prices look to be headed higher while rubber prices have soared 62.8% this [...]
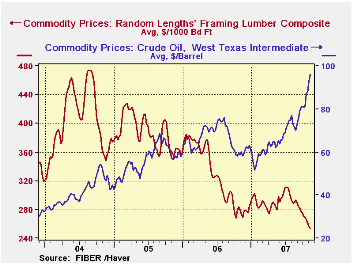
The headline commodity price worry is the rise in oil and
energy prices: 57.2% for WTI and 28.7% for gasoline since the beginning
of the year. And gasoline prices look to be headed higher while rubber
prices have soared 62.8% this year.
With any luck, however, that isn't the whole story. There seem to be other factors which will mitigate the effect that these gains will have on overall consumer price inflation.
The first is that factory sector pricing depends both on
overall demand growth, which is easing, and the overall rise in costs
of which commodity prices account for 25% or less. The other 75% is
labor costs, and the employment cost index for factory workers is up
1.2% so far this year versus a 1.8% gain last year, a 3.4% rise in 2005
and a 4.8% rise during 2004.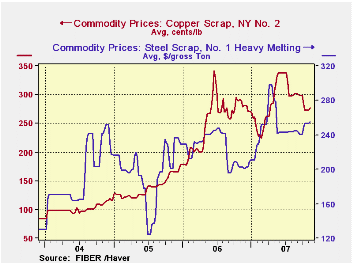
The second is that for the economy overall, the dependence on oil is roughly half what it was in the early 1970s due to conservation and improved efficiencies in production techniques. And, in total, U.S. demand growth has slowed as well as the growth in the Fed's monetization of that growth. Year to year growth in the monetary base through October was 2.5% versus a 3.9% rise last year and a 4.3% 2005 increase.
Finally, other commodity prices have topped or have been
declining. The housing market's weakness has dropped lumber prices 5%
so far this year after a 15% decline last year, and a 4% decline in
2004. In addition, steel scrap prices have been roughly flat this year
after strong gains in years prior. Zinc prices are 31% lower so far
this year and have retraced most of a strong gain at the end of 2006.
Similarly, aluminum prices have fallen 12% this year and have retraced
the strong gains during the latter part of 2006.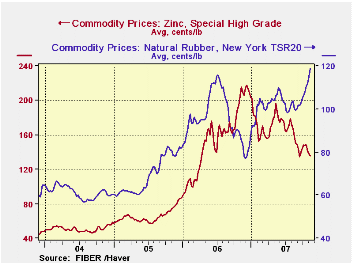
In conclusion, inflation worries have affected the consumer's psychology greatly. The worries have been enough to drop consumer sentiment by nearly one quarter since the highs early this year. This would seem to guarantee some near term slowing in consumer spending. The mitigating factors sighted above, with that luck, will prevent a protracted decline.
OECD Shifts to Slowdown Signalby Robert Brusca November 12, 2007
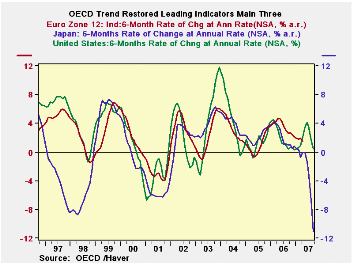
The OECD trend restored leading indicators are now indicating an outright slowing rather than a moderating for growth. These signals have been gradually shifting toward the more pessimistic. Japan’s signal is now quite dour. The US and Europe are showing almost the same degree of slowdown in the new numbers. The table is arrayed with some six month calculations since that is the OECD’s preferred way of assessing its data. No matter how you slice this month the outlook is for weakening.
| OECD Trend-Restored Leading Indicators | ||||
|---|---|---|---|---|
| Growth Progression-SAAR | ||||
| 3Mos | 6Mos | 12mos | Yr-Ago | |
| OECD | -5.8% | -1.0% | 0.4% | 2.6% |
| OECD7 | -7.8% | -1.8% | -0.4% | 1.8% |
| OECD Europe | -4.5% | -1.6% | -0.3% | 2.9% |
| OECD Japan | -21.6% | -12.1% | -6.6% | 1.9% |
| OECD US | -5.3% | 1.3% | 1.4% | 2.0% |
| Six-month Readings at 6-Month Intervals: | ||||
| Recent six | 6Mo Ago | 12Mo Ago | 18MO Ago | |
| OECD | -1.0% | 1.8% | 0.5% | 4.7% |
| OECD 7 | -1.8% | 1.0% | -0.5% | 4.2% |
| OECD Europe | -1.6% | 1.1% | 1.8% | 3.9% |
| OECD Japan | -12.1% | -0.7% | -0.1% | 4.0% |
| OECD US | 1.3% | 1.6% | -0.9% | 5.1% |
| Slowdowns indicated by BOLD RED | ||||
by Louise Curley November 12, 2007

Another indicator that all is not well in Japan was released
today. The seasonally unadjusted diffusion index of consumer confidence
for a two or more person household was 42.8% in October, compared with
44.1% in September and 48.2% in October, 2006. A value below 50% means
that the majority of the participants in the survey have a negative
view of the outlook. While the decline in October is significant, it
should be noted that since June, 1982, when the series began, there
have been few times when the level
of the index was above 50% as can be seen in the first chart. Japanese
consumers have not been particularly optimistic over the past
twenty-five years. Monthly data for confidence are available only since
December 2004.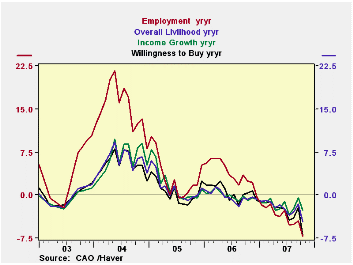
The index is based on the average of four sentiment indexes: Overall Livelihood, Income Growth, Employment and Willingness to Buy. The year to year changes in each of these indexes are shown in the second chart. As shown there, the year to year changes have been declining from their early 2006 peak and, since early 2007, have become negative. The declines in the Employment and Willingness to Buy indexes have been particularly sharp.
| JAPAN: CONSUMER CONFIDENCE (Diffusion Indexes) | Oct 07 | Sep 07 | Oct 06 | M/M Chg | Y/Y Chg | 2006 | 2005 | 2004 |
|---|---|---|---|---|---|---|---|---|
| Total: Two or More Persons Households | 42.8 | 44.1 | 48.2 | -1.3 | -5.4 | 48.3 | 47.3 | 45.6 |
| Overall Livelihood | 41.0 | 42.2 | 45.6 | -1.2 | -4.6 | 45.6 | 45.8 | 44.6 |
| Income Growth | 42.2 | 42.4 | 44.9 | -0.3 | -1.9 | 44.7 | 44.8 | 43.1 |
| Employment | 45.3 | 46.4 | 52.4 | -1.1 | -7.1 | 52.8 | 48.9 | 45.8 |
| Willingness to Buy | 42.5 | 45.5 | 49.8 | -2.7 | -7.0 | 50.0 | 49.5 | 48.9 |

Tom Moeller
AuthorMore in Author Profile »Prior to joining Haver Analytics in 2000, Mr. Moeller worked as the Economist at Chancellor Capital Management from 1985 to 1999. There, he developed comprehensive economic forecasts and interpreted economic data for equity and fixed income portfolio managers. Also at Chancellor, Mr. Moeller worked as an equity analyst and was responsible for researching and rating companies in the economically sensitive automobile and housing industries for investment in Chancellor’s equity portfolio. Prior to joining Chancellor, Mr. Moeller was an Economist at Citibank from 1979 to 1984. He also analyzed pricing behavior in the metals industry for the Council on Wage and Price Stability in Washington, D.C. In 1999, Mr. Moeller received the award for most accurate forecast from the Forecasters' Club of New York. From 1990 to 1992 he was President of the New York Association for Business Economists. Mr. Moeller earned an M.B.A. in Finance from Fordham University, where he graduated in 1987. He holds a Bachelor of Arts in Economics from George Washington University.
More Economy in Brief


