 Global| Nov 12 2010
Commodity Prices Have Strengthened. Are There More Gains To Come?
by:Tom Moeller
|in:Economy in Brief
Summary
After looking at the table below, it's easy to see price strength. The price of gold hit $1,400 per ounce in November, pulling it up nearly one-quarter this year after a like gain in 2009. Silver prices also have been strong. Their [...]
After looking at the table below,
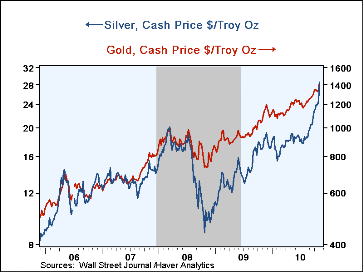
it's easy to see price strength. The price of gold hit $1,400 per ounce in
November, pulling it up nearly one-quarter this year after a like gain in 2009.
Silver prices also have been strong. Their one-third increase during the last
twelve months followed a two-thirds rise during the prior twelve.
 As usually
happens, this type of strength is set against a jump in financial liquidity.
Evidence of that jump is that during the last three years the Adjusted Monetary
Base, tallied by the Federal Reserve Bank of St. Louis, has risen two and
one-half times.
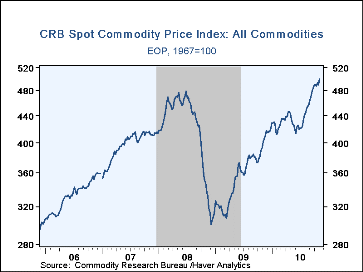
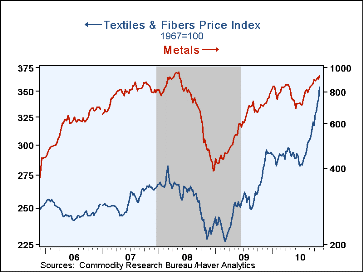
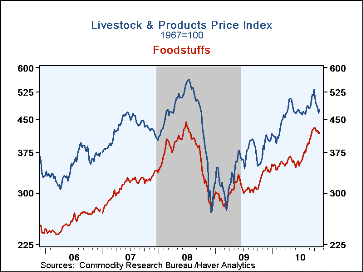
Overall, the sea of financial liquidity has been created against the backdrop of a U.S. economy struggling to grow with too much debt. Moreover, economic strength in China, Australia and India have pulled prices up. As a result, investors are worried about the ultimate inflationary consequences for the U.S. (Dare we say stagflation?). A near-term spark for inflationary concerns is evident in commodity prices which have jumped with the U.S. economic recovery. Despite lacking vigor, the recovery has returned the level of U.S. real economic activity to just below its pre-recession peak. In the industrial sector, though the level of output overall remains depressed versus its earlier high, the 9.6% gain since the recession's bottom has raised capacity utilization. This rebound has raised the FIBER index of industrial prices 60% since its December 2008 low. In the agricultural sector, prices have strengthened as well. The S&P Goldman Sachs Agricultural & Livestock Price Index is just 5% below its 2008 peak after falling by one-third during the recession.
For analysis of gold prices and cotton prices from Haver Analytics see the September 28th and September 21st write-ups by Louise Curley. Commodity price data can be found in Haver's DAILY, WEEKLY and CMDTY databases.
| Commodity Prices | Latest | Oct | Latest YTD | 2009 Avg. | 2008 Avg. | 2007 Avg. |
|---|---|---|---|---|---|---|
| Gold ($ per troy ounce.) | 1,388.50 | 1,336.8 | 23.1% | 1,106.0 | 869.8 | 810.5 |
| Commodity Research Bureau Spot Index - All Commodities (1967=100) | 502 | 490 | 20.0% | 421 | 312 | 415 |
| Foodstuffs | 419 | 426 | 23.0% | 341 | 291 | 340 |
| Livestock & Products | 491 | 499 | 21.6% | 403 | 311 | 405 |
| FIBER Industrial Materials Price Indexes (1990=100) | 169 | 163 | 18.2% | 122 | 148 | 146 |
| Textiles | 89 | 85 | 12.7% | 74 | -- | 73 |
| Cotton (cents per pound) | 142.3 | 106.9 | 109.7% | 52.6 | 58.1 | 53.0 |
| Metals | 277 | 269 | 28.8% | 169 | 231 | 238 |
| Aluminum ($ per metric ton) | 2,425 | 2,345 | 11.7% | 1,665 | 2,572 | 2,640 |
| Copper Scrap (cents per pound) | 396 | 376 | 46.7% | 197 | 281 | 288 |
| Steel Scrap ($ per ton) | 315 | 342 | 37.0% | 204 | 350 | 251 |
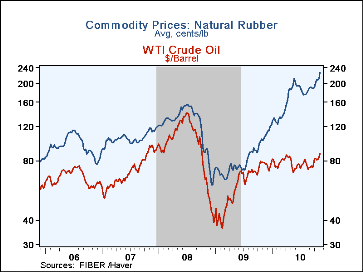
| Crude Oil ($ per barrel) | 87.81 | 81.90 | 11.0% | 61.96 | 99.82 | 72.21 |
| Miscellaneous | 177 | 171 | 18.0% | 128 | 159 | 157 |
| Natural Rubber (cents per pound) | 231 | 210 | 89.3% | 83 | 125 | 105 |
| Framing Lumber ($ per 1000 board) | 269 | 252 | 7.2% | 221 | 253 | 284 |
Tom Moeller
AuthorMore in Author Profile »Prior to joining Haver Analytics in 2000, Mr. Moeller worked as the Economist at Chancellor Capital Management from 1985 to 1999. There, he developed comprehensive economic forecasts and interpreted economic data for equity and fixed income portfolio managers. Also at Chancellor, Mr. Moeller worked as an equity analyst and was responsible for researching and rating companies in the economically sensitive automobile and housing industries for investment in Chancellor’s equity portfolio. Prior to joining Chancellor, Mr. Moeller was an Economist at Citibank from 1979 to 1984. He also analyzed pricing behavior in the metals industry for the Council on Wage and Price Stability in Washington, D.C. In 1999, Mr. Moeller received the award for most accurate forecast from the Forecasters' Club of New York. From 1990 to 1992 he was President of the New York Association for Business Economists. Mr. Moeller earned an M.B.A. in Finance from Fordham University, where he graduated in 1987. He holds a Bachelor of Arts in Economics from George Washington University.


