 Global| Jul 05 2011
Commodity Prices Find Some Support
by:Tom Moeller
|in:Economy in Brief
Summary
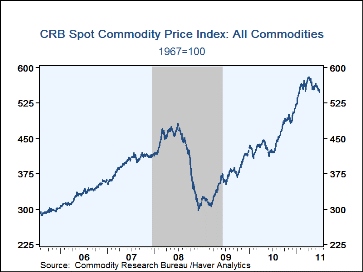
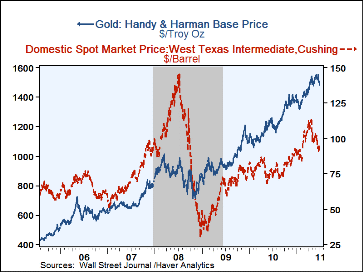
Commodity prices recently have given mixed signals about inflationary pressures and the economy. Gold prices have backed off their recent high and as of yesterday traded at $1,483 per ounce versus the mid-June level of $1,553. Showing [...]
Commodity prices recently have given mixed signals about inflationary pressures and the economy. Gold prices have backed off their recent high and as of yesterday traded at $1,483 per ounce versus the mid-June level of $1,553. Showing persistent weakness have been crude oil prices at $94.94 per barrel, versus the late-April high of $113.93. The latest was, however, up from the week-earlier low of $91.02. Elsewhere, weak economic news from the U.S. including housing activity, real consumer spending and industrial output had been part of the downward pressure on prices, but prices have stabilized. Earlier, economic forecasts were revised lower but expectations remain for a H2 improvement.
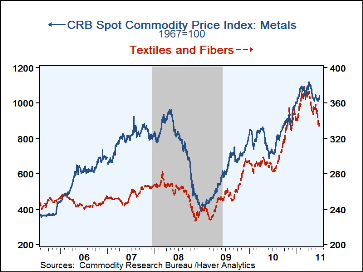
Industrial commodity prices seem to be finding a floor after earlier decline. The FIBER price index is down roughly 8% from its April high but prices recently have stabilized, notably for zinc, aluminum and copper scrap. Even in the housing sector, lumber costs have found some support after the 15% decline from the January high. Natural rubber prices continue lower after a 30% drop from the February peak.
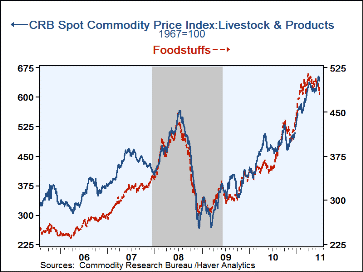
Agricultural commodity prices have been persistently weak. Lower wheat prices have led the pace with a one-quarter decline since early-April. In addition corn prices are down 20% just in the last month. Meat prices have shown lesser declines from the Spring peaks.
Commodity price data can be found in Haver's DAILY, WEEKLY and CMDTY databases.
| Commodity Prices | Latest | Latest Y/Y | 2010 | 2009 | 2008 |
|---|---|---|---|---|---|
| Gold($ per troy ounce.) | 1,483 | 23.4% | 1,224.3 | 972.3 | 872.0 |
| Crude Oil($ per barrel) | 94.94 | 31.6 | 79.42 | 61.83 | 99.83 |
| Commodity Research Bureau Spot
Index - All Commodities (1967=100) |
548.0 | 30.4 | 451 | 361 | 422 |
| Foodstuffs | 479.8 | 35.8 | 379 | 310 | 373 |
| Livestock & Products | 642.5 | 37.4 | 470 | 355 | 457 |
| FIBER Industrial Materials Price Indexes (1990=100) | 174.5 | 15.8 | 158 | 122 | 148 |
| Textiles | 86.41 | 10.1 | 81 | 73 | 74 |
| Cotton (cents per pound) | 131.4 | 72.1 | 88.0 | 52.6 | 58.1 |
| Metals | 290.4 | 38.0 | 240 | 169 | 231 |
| Aluminum ($ per metric ton) | 2,508 | 30.1 | 2,173 | 1,665 | 2,572 |
| Copper Scrap (cents per pound) | 421.9 | 46.4 | 327 | 197 | 281 |
| Steel Scrap ($ per ton) | 416.7 | 28.3 | 327 | 204 | 350 |
| Miscellaneous | 188.0 | 4.6 | 179 | 128 | 159 |
| Natural Rubber(cents per pound) | 241.2 | 27.5 | 183 | 84 | 124 |
| Framing Lumber($ per 1000 board) | 262 | 6.1 | 293 | 221 | 253 |
Tom Moeller
AuthorMore in Author Profile »Prior to joining Haver Analytics in 2000, Mr. Moeller worked as the Economist at Chancellor Capital Management from 1985 to 1999. There, he developed comprehensive economic forecasts and interpreted economic data for equity and fixed income portfolio managers. Also at Chancellor, Mr. Moeller worked as an equity analyst and was responsible for researching and rating companies in the economically sensitive automobile and housing industries for investment in Chancellor’s equity portfolio. Prior to joining Chancellor, Mr. Moeller was an Economist at Citibank from 1979 to 1984. He also analyzed pricing behavior in the metals industry for the Council on Wage and Price Stability in Washington, D.C. In 1999, Mr. Moeller received the award for most accurate forecast from the Forecasters' Club of New York. From 1990 to 1992 he was President of the New York Association for Business Economists. Mr. Moeller earned an M.B.A. in Finance from Fordham University, where he graduated in 1987. He holds a Bachelor of Arts in Economics from George Washington University.


