 Global| Apr 01 2003
"CNN Effect" Depressed Chain Store Sales
by:Tom Moeller
|in:Economy in Brief
Summary
Chain store sales slumped 1.4% last week according to the BTM-UBSW survey. The report indicated that the so called "CNN effect" -- when consumers stay home to watch TV rather than head out to shop -- was instrumental in restraining [...]
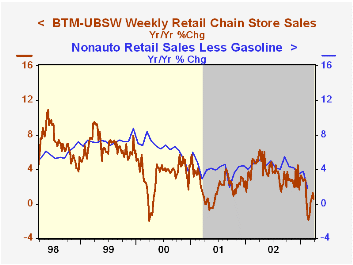
Chain store sales slumped 1.4% last week according to the BTM-UBSW survey. The report indicated that the so called "CNN effect" -- when consumers stay home to watch TV rather than head out to shop -- was instrumental in restraining sales."
The decline in sales was the largest in one week since early December 2002 and pulled March sales 0.1% below the February average.
During the last nine years there has been a 57% correlation between the year-to-year percent change in these chain store sales and the change in nonauto retail sales less gasoline.
| BTM-UBSW (SA, 1977=100) | 3/29/03 | 3/22/03 | Y/Y | 2002 | 2001 | 2000 |
|---|---|---|---|---|---|---|
| Total Weekly Retail Chain Store Sales | 404.4 | 410.3 | 0.5% | 3.6% | 2.1% | 3.4% |
by Tom Moeller April 1, 2003
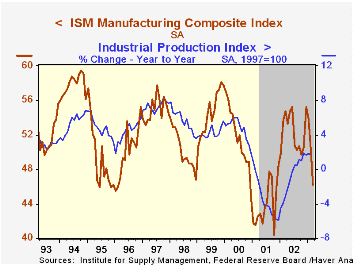
The ISM Composite Index of manufacturing sector activity fell more than expected last month. It was the first month the index was below 50 since October, thus indicating a decline in factory sector activity, and the lowest index level since November 2001.
Consensus expectations were for a reading of 49.5.
During the last ten years there has been a 50% correlation between the level of the ISM index and the month to month change in factory sector industrial production.
Four of the five component series declined last month. New orders and production both fell sharply and were below 50. The vendor delivery index rose slightly (indicating slower delivery speeds) for the second month.
The separate index of inflation pressure surged to the highest level since April 2000. This index is not seasonally adjusted.
| ISM Manufacturing Survey | Mar | Feb | Y/Y | 2002 | 2001 | 2000 |
|---|---|---|---|---|---|---|
| Composite Index | 46.2 | 50.5 | 54.7 | 52.4 | 44.0 | 51.7 |
| Prices Paid Index (NSA) | 70.0 | 65.5 | 51.0 | 58.0 | 42.9 | 64.8 |
by Tom Moeller April 1, 2003
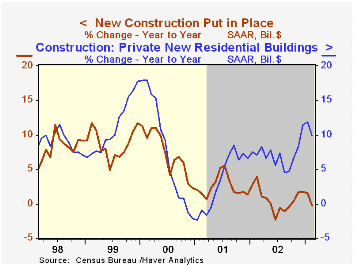
The value of construction put in place fell about as expected in February. The strong gain in January was revised up slightly but December was revised down.
In constant 1996 dollars, overall construction spending fell 0.5% (-3.6% y/y). Real residential spending was unchanged (5.0% y/y). Real nonresidential activity rose 0.1% (-15.3% y/y).
In nominal terms, residential building expenditures on one-unit structures fell a slight 0.1% (12.0% y/y) following a surge in activity in each of the prior five months. Spending on multi-unit structures also was strong for the third consecutive month (8.6% y/y).
Nonresidential building activity added slightly to a strong January gain despite sharp declines in industrial (-27.6% y/y) and office building (-23.0% y/y).
Public construction fell sharply due to widespread weakness amongst categories.
| Construction Put-in-place | Feb | Jan | Y/Y | 2002 | 2001 | 2000 |
|---|---|---|---|---|---|---|
| Total | -0.2% | 2.0% | -0.2% | 0.7% | 2.5% | 7.3% |
| Residential | 0.6% | 2.6% | 9.9% | 7.1% | 3.3% | 7.4% |
| Nonresidential | 0.3% | 1.7% | -13.3% | -16.4% | -3.1% | 7.1% |
| Public | -3.0% | 1.6% | -5.2% | 6.2% | 7.4% | 5.4% |
by Tom Moeller April 1, 2003
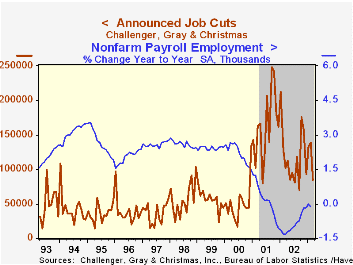
According to Challenger, Gray & Christmas, announced job cuts fell sharply in March to the lowest level since September. The decline followed two months of elevated layoff activity.
The three month moving average of job cut announcements slipped 2.1% from the prior month and was 19.7% below the year ago level.
Job cut announcements differ from layoffs in that many are achieved through attrition or just never occur.
Announcements of job cuts fell sharply in most industries except electronics and transportation where they rose sharply.
During the last ten years there has been a (negative) 74% correlation between the level of announced job cuts and the y/y percent change in nonfarm payrolls.
| Challenger, Gray & Christmas | Mar | Feb | Y/Y | 2002 | 2001 |
|---|---|---|---|---|---|
| Announced Job Cuts | 85,396 | 138,177 | -16.5% | 1,431,052 | 1,956,876 |

Tom Moeller
AuthorMore in Author Profile »Prior to joining Haver Analytics in 2000, Mr. Moeller worked as the Economist at Chancellor Capital Management from 1985 to 1999. There, he developed comprehensive economic forecasts and interpreted economic data for equity and fixed income portfolio managers. Also at Chancellor, Mr. Moeller worked as an equity analyst and was responsible for researching and rating companies in the economically sensitive automobile and housing industries for investment in Chancellor’s equity portfolio. Prior to joining Chancellor, Mr. Moeller was an Economist at Citibank from 1979 to 1984. He also analyzed pricing behavior in the metals industry for the Council on Wage and Price Stability in Washington, D.C. In 1999, Mr. Moeller received the award for most accurate forecast from the Forecasters' Club of New York. From 1990 to 1992 he was President of the New York Association for Business Economists. Mr. Moeller earned an M.B.A. in Finance from Fordham University, where he graduated in 1987. He holds a Bachelor of Arts in Economics from George Washington University.


