 Global| Dec 30 2003
Chicago Purchasing Agents' Index Down More Than Expected
by:Tom Moeller
|in:Economy in Brief
Summary
The Chicago Purchasing Managers Business Barometer for December gave back slightly more of the prior month's surge than was expected. The decline to 59.2 was versus Consensus expectations for a decline to 62.0 and followed the [...]

The Chicago Purchasing Managers Business Barometer for December gave back slightly more of the prior month's surge than was expected. The decline to 59.2 was versus Consensus expectations for a decline to 62.0 and followed the November jump to 64.1 from 55.0 in October.
During the last twenty years there has been a 55% correlation between the level of the Chicago PMI and quarterly growth in real GDP.
The new orders index (65.5) fell the hardest m/m but the level was still the second highest in four years. Production (63.4) gave back less of the November jump and remained at the second highest level since May 2002.
Employment (49.6) recovered some of the November decline and for the fourth quarter was at the highest level (50.4) since 1Q 2000.
The index of prices paid fell sharply and gave back much of the gains in the prior two months.
| Chicago Purchasing Managers Index, SA | Dec | Nov | Y/Y | 2003 | 2002 | 2001 |
|---|---|---|---|---|---|---|
| Business Barometer | 59.2 | 64.1 | 51.7 | 54.7 | 52.7 | 41.4 |
| New Orders | 65.5 | 73.3 | 56.0 | 58.1 | 56.3 | 42.3 |
| Prices Paid | 58.6 | 67.3 | 61.8 | 55.8 | 56.9 | 50.4 |
by Tom Moeller December 30, 2003
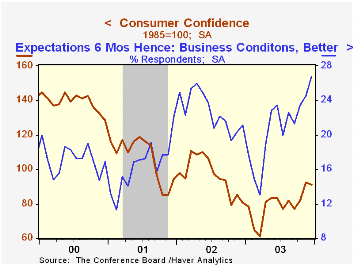
The Conference Board’s Index of Consumer Confidence fell about as expected in December to 91.3. November's level was revised up.
The 1.3% m/m decline in Confidence matched the decline in Consumer Sentiment reported by the University of Michigan.
The expectations index added to the prior month's jump and rose to 102.9. November was revised up.
The reading of the present situation retraced half of the prior month's surge and fell to 73.9.
Jobs were viewed as hard to get by 32.6% of respondents. The increase from November recouped much of that month's decline but the level remained down from the 35.1% September high.
Expectations for business conditions in six months improved to the best level since late 1992.
The Conference Board’s survey isconducted by a mailed questionnaire to 5,000 households and about 3,500 typically respond.
| Conference Board | Dec | Nov | Y/Y | 2003 | 2002 | 2001 |
|---|---|---|---|---|---|---|
| Consumer Confidence | 91.3 | 92.5 | 13.1% | 79.5 | 96.6 | 106.6 |
by Tom Moeller December 30, 2003
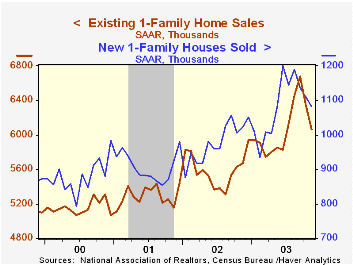
Sales of existing single family homes reported by the National Association of Realtors fell 4.6% in November to 6.06M. The decline about matched the 4.9% October drop and was versus Consensus expectations for an increase.
The figures reflect closings of home sales in earlier months.
Sales fell across the nation. In the Northeast sales fell 4.1% (+6.1% y/y). In the Midwest sales fell 6.6% (+1.6% y/y). Sales in the South fell 5.1% (+8.0% y/y) and in the West sales fell 2.4% (+9.3% y/y).
The median price of an existing home fell m/m to $170,900 (+5.9% y/y).
The latest release from the National Association of Realtors is available here.
| Existing Home Sales (000, AR) | Nov | Oct | Y/Y | 2002 | 2001 | 2000 |
|---|---|---|---|---|---|---|
| Existing Single-Family | 6,060 | 6,350 | 6.9% | 5,595 | 5,292 | 5,158 |
by Tom Moeller December 30, 2003
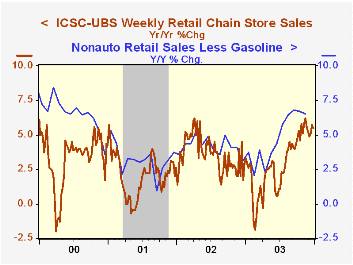
Chain store sales surged 2.0% during Christmas week, according to the ICSC-UBS survey. That increase added to 0.6% and 2.1% gains in the prior two weeks.
The late month jump pulled sales for December almost even (-0.3%) with the November average. During all of November sales rose 0.5% versus the prior month.
During the last five years there has been a 61% correlation between the year-to-year percent change in the ICSC-UBS measure of chain store sales and the change in non-auto retail sales less gasoline.
The ICSC-UBS retail chain-store sales index is constructed using the same-store sales reported by 78 stores of seven retailers: Dayton Hudson, Federated, Kmart, May, J.C. Penney, Sears and Wal-Mart.
| ICSC-UBS (SA, 1977=100) | 12/27/03 | 12/20/03 | Y/Y | 2002 | 2001 | 2000 |
|---|---|---|---|---|---|---|
| Total Weekly Retail Chain Store Sales | 431.4 | 423.1 | 5.5% | 3.6% | 2.1% | 3.4% |

Tom Moeller
AuthorMore in Author Profile »Prior to joining Haver Analytics in 2000, Mr. Moeller worked as the Economist at Chancellor Capital Management from 1985 to 1999. There, he developed comprehensive economic forecasts and interpreted economic data for equity and fixed income portfolio managers. Also at Chancellor, Mr. Moeller worked as an equity analyst and was responsible for researching and rating companies in the economically sensitive automobile and housing industries for investment in Chancellor’s equity portfolio. Prior to joining Chancellor, Mr. Moeller was an Economist at Citibank from 1979 to 1984. He also analyzed pricing behavior in the metals industry for the Council on Wage and Price Stability in Washington, D.C. In 1999, Mr. Moeller received the award for most accurate forecast from the Forecasters' Club of New York. From 1990 to 1992 he was President of the New York Association for Business Economists. Mr. Moeller earned an M.B.A. in Finance from Fordham University, where he graduated in 1987. He holds a Bachelor of Arts in Economics from George Washington University.
More Economy in Brief


