 Global| May 05 2003
Chicago Fed National Activity Index Negative
by:Tom Moeller
|in:Economy in Brief
Summary
The Chicago Fed National Activity Index (CFNAI) improved in March, but the index level still was negative as it has been for most of the last three years. . A zero value of the CFNAI indicates that the economy is expanding at its [...]
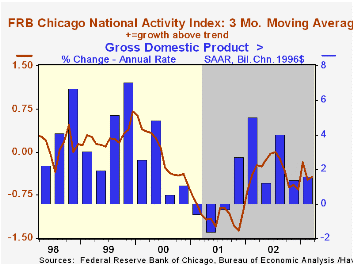
The Chicago Fed National Activity Index (CFNAI) improved in March, but the index level still was negative as it has been for most of the last three years. . A zero value of the CFNAI indicates that the economy is expanding at its historical trend rate of growth (just over 3% p.a. during the last ten years).
The three-month moving average of the CFNAI was -0.43. That's consistent with roughly 1-2% growth in real GDP.
During the last ten years there has been a 73% correlation between the level of the CFNAI and quarterly growth in real GDP.
The CFNAI is a weighted average of 85 indicators of economic activity. The indicators reflect activity in the following categories: production & income, the labor market, personal consumption & housing, mfg. & trade sales, and inventories & orders.
For a complete discussion of the latest Chicago Fed's National Activity Index click here.
A discussion of the CFNAI and its role as a business cycle indicator can be found here.
| Chicago Fed | Mar | Feb | Mar '02 | 2002 | 2001 | 2000 |
|---|---|---|---|---|---|---|
| CFNAI | -0.67 | -1.24 | -0.28 | -0.31 | -1.13 | -0.13 |
by Tom Moeller May 5, 2003
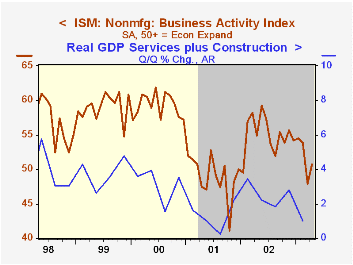
The Institute for Supply Management business activity index of the nonmanufacturing sector rose last month to 50.7. That was more than Consensus expectations for a smaller gain to 49.0.
The 2.8 point rise recouped just half of the sharp decline in the prior month.
During the last five years, there has been a 70% correlation between the level of the Business Activity Index from the ISM nonmanufacturing survey and quarterly growth in real GDP in the service sector plus structures.
The seasonally adjusted new orders index rose modestly to 50.6 as did the employment index to 48.2.Business activity for the nonmanufacturing sector is a question separate from the subgroups mentioned above. In contrast, the NAPM manufacturing sector composite index weights the components.
The seasonally adjusted index of prices fell to 56.7, the lowest level this year.
ISM surveys more than 370 purchasing managers in more than 62 industries including construction, law firms, hospitals, government and retailers. The nonmanufacturing survey dates only to July 1997, therefore its seasonal adjustment should be viewed tentatively.
| ISM Nonmanufacturing Survey | April | Mar | Y/Y | 2002 | 2001 | 2000 |
|---|---|---|---|---|---|---|
| Business Activity Index | 50.7 | 47.9 | 54.9 | 55.1 | 49.0 | 59.3 |
| Prices Index | 56.7 | 62.0 | 54.8 | 53.9 | 51.6 | 63.5 |
by Tom Moeller May 5, 2003
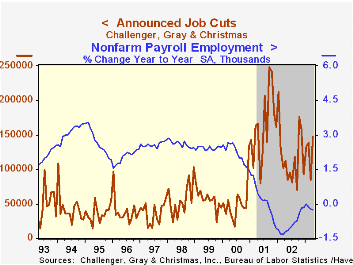
According to Challenger, Gray & Christmas, announced job cuts surged in April to the highest level since November. The rise followed a sharp decline in March and pulled the three month moving average of job cut announcements more than one third higher than last summer.
Job cut announcements differ from layoffs in that many are achieved through attrition or just never occur.
Announcements of job cuts rose in most industries except computers where they fell for the second month. Layoff announcements also fell in the transportation, electronics and health care industries.
During the last ten years there has been a (negative) 75% correlation between the level of announced job cuts and the y/y percent change in nonfarm payrolls.
| Challenger, Gray & Christmas | April | Mar | Y/Y | 2002 | 2001 |
|---|---|---|---|---|---|
| Announced Job Cuts | 146,399 | 85,396 | 30.0% | 1,431,052 | 1,956,876 |

Tom Moeller
AuthorMore in Author Profile »Prior to joining Haver Analytics in 2000, Mr. Moeller worked as the Economist at Chancellor Capital Management from 1985 to 1999. There, he developed comprehensive economic forecasts and interpreted economic data for equity and fixed income portfolio managers. Also at Chancellor, Mr. Moeller worked as an equity analyst and was responsible for researching and rating companies in the economically sensitive automobile and housing industries for investment in Chancellor’s equity portfolio. Prior to joining Chancellor, Mr. Moeller was an Economist at Citibank from 1979 to 1984. He also analyzed pricing behavior in the metals industry for the Council on Wage and Price Stability in Washington, D.C. In 1999, Mr. Moeller received the award for most accurate forecast from the Forecasters' Club of New York. From 1990 to 1992 he was President of the New York Association for Business Economists. Mr. Moeller earned an M.B.A. in Finance from Fordham University, where he graduated in 1987. He holds a Bachelor of Arts in Economics from George Washington University.
More Economy in Brief


