 Global| Nov 21 2006
Chicago Fed Nat'l Activity Index Remained Negative
by:Tom Moeller
|in:Economy in Brief
Summary
The National Activity Index (CFNAI) from the Federal Reserve Bank of Chicago remained negative in October at -0.31, negative for the fifth month in the last six. The three-month moving average of the CFNAI dropped to -0.19, its lowest [...]
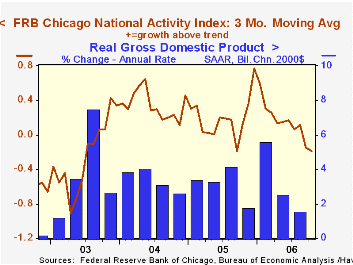
The National Activity Index (CFNAI) from the Federal Reserve Bank of Chicago remained negative in October at -0.31, negative for the fifth month in the last six. The three-month moving average of the CFNAI dropped to -0.19, its lowest level since Hurricane Katrina depressed activity last year.
A zero value of the CFNAI indicates that the economy is expanding at its historical trend rate of growth and during the last twenty years there has been a 68% correlation between the level of the CFNAI and q/q growth in real GDP.
The CFNAI is a weighted average of 85 indicators of economic activity. The indicators reflect activity in the following categories: production and income, the labor market, personal consumption and housing, manufacturing and trade sales, and inventories & orders.
The complete CFNAI report is available here.
The latest Survey of Professional Forecasters from the Federal Reserve Bank of Philadelphia is available here.
| Chicago Fed | October | September | October '05 | 2005 | 2004 | 2003 |
|---|---|---|---|---|---|---|
| CFNAI | -0.31 | -0.38 | 1.03 | 0.20 | 0.35 | -0.15 |
by Tom Moeller November 21, 2006
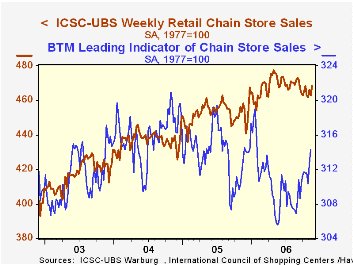
The ICSC-UBS retail chain-store sales index is constructed using the same-store sales (stores open for one year) reported by 78 stores of seven retailers: Dayton Hudson, Federated, Kmart, May, J.C. Penney, Sears and Wal-Mart.
The leading indicator of chain store sales from ICSC-UBS added 0.5% (0.8% y/y) to the prior week's 0.8% jump.
| ICSC-UBS (SA, 1977=100) | 11/18/06 | 11/11/06 | Y/Y | 2005 | 2004 | 2003 |
|---|---|---|---|---|---|---|
| Total Weekly Chain Store Sales | 468.2 | 462.9 | 2.2% | 3.6% | 4.7% | 2.9% |
by Tom Moeller November 21, 2006
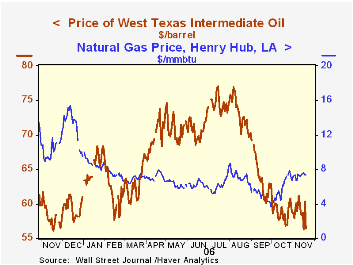 Crude oil prices, however, have moved lower. WTI crude yesterday traded for $56.46 (-1.3% y/y) per barrel versus an average $58.88 during October and $63.86 in September.
The heating season also has given some lift to natural gas prices. At $7.35 per mmbtu (-28.5% y/y) yesterday, the Henry Hub price was up from an average of $5.77 in October and $4.90 during September.
Crude oil prices, however, have moved lower. WTI crude yesterday traded for $56.46 (-1.3% y/y) per barrel versus an average $58.88 during October and $63.86 in September.
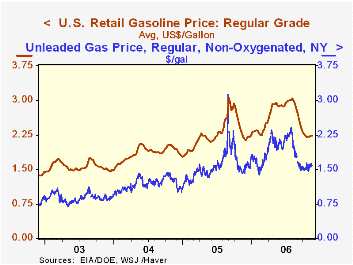
The heating season also has given some lift to natural gas prices. At $7.35 per mmbtu (-28.5% y/y) yesterday, the Henry Hub price was up from an average of $5.77 in October and $4.90 during September.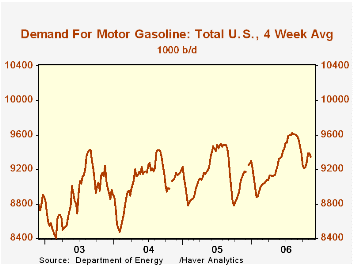 The Department of Energy reported that gasoline demand during the latest four weeks rose 2.6% from the year earlier period. That increase, however, continued to understate the demand for gasoline according to estimated figures from the Oil & Gas Journal which showed a 7.1% rise. These figures are available in the Haver OILWKLY database.
The latest Short-Term Energy Outlook from the U.S. Energy Information Administration is available here.
The Department of Energy reported that gasoline demand during the latest four weeks rose 2.6% from the year earlier period. That increase, however, continued to understate the demand for gasoline according to estimated figures from the Oil & Gas Journal which showed a 7.1% rise. These figures are available in the Haver OILWKLY database.
The latest Short-Term Energy Outlook from the U.S. Energy Information Administration is available here.
Financial Markets and the Federal Reserve are remarks by Fed Governor Kevin M. Warsh at the New York Stock Exchange and they are available here.
| Weekly Energy Prices | 11/20/06 | 11/13/06 | Y/Y | 2005 | 2004 | 2003 |
|---|---|---|---|---|---|---|
| US Retail Gasoline Price, Regular | $2.24 | $2.23 | 1.7% | $2.27 | $1.85 | $1.56 |
by Louise Curley November 21, 2006
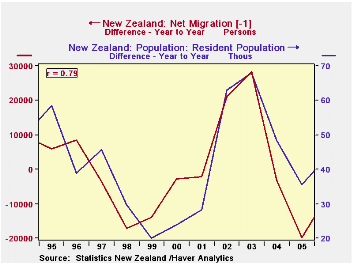
As a small country with a population of only 4.2 million, migration in and out of New Zealand tends to amplify economic trends that would not be noticed in a larger country. The peripatetic New Zealanders frequently go to and from Australia and the UK staying a year or more. In recent years there has been an influx of students from Asia who also tend to stay for a period of years completing their education and then returning home. New Zealand tracks these movements and publishes monthly data on net permanent and long term migration. (Total net migration and net migration by country can be found in the Haver data base, ANZ.)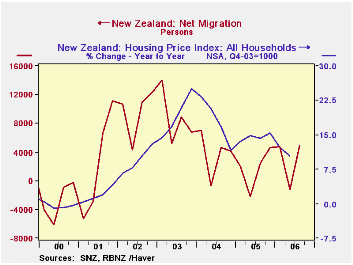
Net permanent and long-term migration is derived by subtracting permanent and long-term departures from permanent and long-term arrivals. Permanent and long- term arrivals include overseas migrants intending to stay for a period of twelve months or more or permanently, plus New Zealand residents returning after an absence of 12 months or more. Permanent and long-term departures include New Zealand residents intending to stay abroad for 12 months or more or permanently plus overseas visitors departing after a stay of 12 months or more.
As the first chart shows, year to year differences in net migration are largely responsible for the unusual ups and downs in the total population. The large influx of immigrants in 2001 and 2002 had a notable effect on the housing market as can be seen in the second chart that shows the year to year changes in housing prices and net migration. The decline in net migration has, in part, been a factor in the deceleration of GDP growth that has taken place since the end of 2004 as can be seen in the third chart.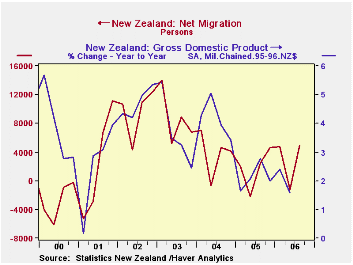
Net migration varies from quarter to quarter but the downward trend started in late 2002 seems to have abated. In the third quarter of this year, net migration was 4,965, the highest quarterly figure since the first quarter of 2004. To the extent that migration matters, economic developments in New Zealand may be looking up.
| NEW ZEALAND | Oct 06 | Q3 06 | Q2 06 | Q 1 06 | 2005 | 2004 | 2003 | 2002 | 2001 |
|---|---|---|---|---|---|---|---|---|---|
| Net Migration (persons) | 2352 | 4965 | -1201 | 4772 | 6971 | 15108 | 34906 | 38198 | 9726 |
| Population (000) | 4152 | 4140 | 4134 | 4105 | 4065 | 4018 | 3950 | 3891 | |
| Q3 06 | Q2 06 | Q 1 06 | 2005 | 2004 | 2003 | 2002 | 2001 | ||
| Real GDP (SAAR) | 1.69 | 2.59 | 2.12 | 4.16 | 3.64 | 4.23 | 2.51 | ||
| House Prices (% Chg) | 3.69 | 10.31 | 14.51 | 17.97 | 19.41 | 9.51 | 1.83 | ||

Tom Moeller
AuthorMore in Author Profile »Prior to joining Haver Analytics in 2000, Mr. Moeller worked as the Economist at Chancellor Capital Management from 1985 to 1999. There, he developed comprehensive economic forecasts and interpreted economic data for equity and fixed income portfolio managers. Also at Chancellor, Mr. Moeller worked as an equity analyst and was responsible for researching and rating companies in the economically sensitive automobile and housing industries for investment in Chancellor’s equity portfolio. Prior to joining Chancellor, Mr. Moeller was an Economist at Citibank from 1979 to 1984. He also analyzed pricing behavior in the metals industry for the Council on Wage and Price Stability in Washington, D.C. In 1999, Mr. Moeller received the award for most accurate forecast from the Forecasters' Club of New York. From 1990 to 1992 he was President of the New York Association for Business Economists. Mr. Moeller earned an M.B.A. in Finance from Fordham University, where he graduated in 1987. He holds a Bachelor of Arts in Economics from George Washington University.
More Economy in Brief


