 Global| Feb 20 2007
Chicago Fed Nat'l Activity Index Quite Negative
by:Tom Moeller
|in:Economy in Brief
Summary
The National Activity Index (CFNAI) from the Federal Reserve Bank of Chicago in January reversed all of its upwardly revised December improvement. The decline to -0.74 was to the lowest level since September 2005. The three-month [...]
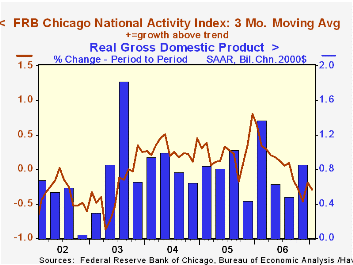
The National Activity Index (CFNAI) from the Federal Reserve Bank of Chicago in January reversed all of its upwardly revised December improvement. The decline to -0.74 was to the lowest level since September 2005.
The three-month moving average of the CFNAI also fell sharply to -0.29 and it was the fifth straight month in negative territory.
A zero value of the CFNAI indicates that the economy is expanding at its historical trend rate of growth and during the last twenty years there has been a 68% correlation between the level of the CFNAI and q/q growth in real GDP.
All of the CFNAI components contributed to the January decline including production, employment, consumption and housing.
The CFNAI is a weighted average of 85 indicators of economic activity. The indicators reflect activity in the following categories: production and income, the labor market, personal consumption and housing, manufacturing and trade sales, and inventories & orders.
The complete CFNAI report is available here.Michigan Labor Market--Still Awaiting Recovery from the Federal Reserve Bank of Chicago can be found here.
| Chicago Fed | January | December | January '06 | 2006 | 2005 | 2004 |
|---|---|---|---|---|---|---|
| CFNAI | -0.74 | 0.36 | 0.48 | 0.02 | 0.25 | 0.31 |
by Louise Curley February 20, 2007
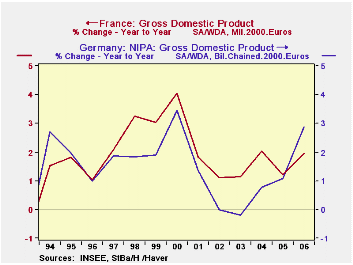
Details of France's fourth quarter Gross Domestic Product were released today.The 0.65% increase in GDP for the fourth quarter reported in the flash estimate of a week ago was confirmed. It compares with a 0.87% increase reported for Germany. For the year as a whole, French GDP rose 2.0 and Germany, 2.9%. 2006 marked the first time since 1995, that Germany's annual growth rate exceeded that of France. The first chart shows the annual growth of both countries' GDPs.
 In the second chart we have plotted, for France, the sum of consumption and gross fixed capital formation as a proxy for domestic demand and total gross domestic product. The difference between the two lines is roughly equivalent to France's net exports of goods and services. Until about mid 2003 France maintained a surplus on trade in goods and services. For a year or so, there was a balance and ever since late 2004, a deficit. It is this shift in the French trade balance that is largely responsible for the deceleration in French economic growth. In contrast to France, Germany has experienced an increasingly favorable balance of trade in goods since 2001, as can be seen in the third chart.
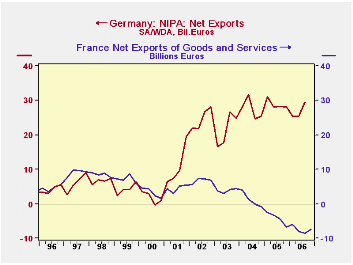 (In this chart we have used the nominal figures to simplify the calculations necessary for the comparison.Real values of German net exports in billions of euros have to be calculated. The nominal values are available. While French net exports are available in both real and nominal terms, the data are in millions of euros and have to be converted into billions.)
| GROSS DOMESTIC PRODUCT | Q4 06 | 3Q 06 | 2Q 06 | 1Q 06 | 2006 | 2005 | 2004 | 2003 |
|---|---|---|---|---|---|---|---|---|
| France (% change) | 0.65 | 0.01 | 1.06 | 0.50 | 1.96 | 1.21 | 2.03 | 1.13 |
| Germany (% change | .087 | 0.79 | 1.18 | 0.84 | 2.89 | 1.10 | 0.77 | -0.20 |
| NET EXPORT OF GOODS AND SERVICES | ||||||||
| France (billion euros) | -7.27 | -8.58 | -8.00 | -5.87 | -29.72 | -16.70 | 4.30 | 15.38 |
| Germany (billion euros) | n.a. | 29.56 | 25.36 | 25.42 | n.a. | 115.47 | 109.76 | 85.75 |

Tom Moeller
AuthorMore in Author Profile »Prior to joining Haver Analytics in 2000, Mr. Moeller worked as the Economist at Chancellor Capital Management from 1985 to 1999. There, he developed comprehensive economic forecasts and interpreted economic data for equity and fixed income portfolio managers. Also at Chancellor, Mr. Moeller worked as an equity analyst and was responsible for researching and rating companies in the economically sensitive automobile and housing industries for investment in Chancellor’s equity portfolio. Prior to joining Chancellor, Mr. Moeller was an Economist at Citibank from 1979 to 1984. He also analyzed pricing behavior in the metals industry for the Council on Wage and Price Stability in Washington, D.C. In 1999, Mr. Moeller received the award for most accurate forecast from the Forecasters' Club of New York. From 1990 to 1992 he was President of the New York Association for Business Economists. Mr. Moeller earned an M.B.A. in Finance from Fordham University, where he graduated in 1987. He holds a Bachelor of Arts in Economics from George Washington University.
More Economy in Brief


