 Global| Mar 22 2010
Chicago Fed Index Indicates SlowerGrowth Last Month
by:Tom Moeller
|in:Economy in Brief
Summary
Economic activity slowed last month according to the Chicago Fed National Activity Index (CFNAI) from the Federal Reserve Bank of Chicago. Was severe winter weather behind the slowdown or was there more behind the index decline to [...]
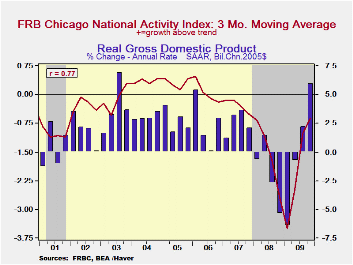
Economic activity slowed last month according to the Chicago Fed National Activity Index (CFNAI) from the Federal Reserve Bank of Chicago. Was severe winter weather behind the slowdown or was there more behind the index decline to -0.64 from a downwardly revised -0.04 in January? Regardless, positive economic growth still was indicated by the increase from the series' low of -4.14 reached one year ago. During the last ten years the has been a 76% correlation between the index level and the q/q change in real GDP.
The three-month moving average of the index, which smoothes out some of the series' volatility, also fell to -0.39 from its highest level since 2007.
An index level at or below -0.70 typically has indicated negative U.S. economic growth. A zero value of the CFNAI indicates that the economy is expanding at its historical trend rate of growth of roughly 3.0%. The complete CFNAI report is available here.
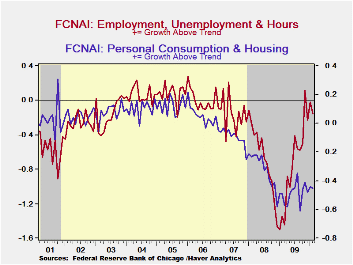
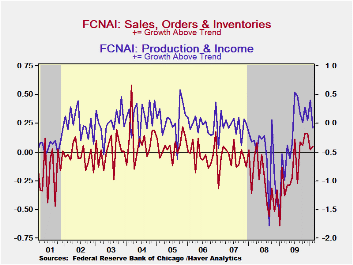
The Chicago Fed indicated that each of the series' components except sales, inventories & orders contributed negatively to the overall decline. Overall, a reduced 34 of the 85 individual indicators made positive contributions to the index while 51 made negative contributions. The CFNAI is a weighted average of 85 indicators of economic activity. The indicators reflect activity in the following categories: production & income, the labor market, personal consumption & housing, manufacturing & trade sales, and inventories & orders.
In a separate survey, the Chicago Fed indicated that its Midwest manufacturing index improved during January to its highest level since December 2008. Indicators for the auto, steel, machinery and resource sectors each rose. The Chicago Federal Reserve figures are available in Haver's SURVEYS database.
| Chicago Fed | February | January | December | February '09 | 2009 | 2008 | 2007 |
|---|---|---|---|---|---|---|---|
| CFNAI | -0.64 | -0.04 | -0.50 | -2.48 | -1.62 | -1.79 | -0.35 |
| 3-Month Moving Average | -0.39 | -0.13 | -0.42 | -3.47 | -- | -- | -- |
| Personal Consumption & Housing | -0.45 | -0.44 | -0.48 | -0.49 | -0.49 | -0.32 | -0.09 |
| Employment, Unemployment & Hours | -0.16 | -0.02 | -0.23 | -1.34 | -0.76 | -0.67 | -0.15 |
| Production & Income | -0.08 | 0.41 | 0.05 | -0.53 | -0.24 | -0.56 | -0.05 |
| Sales, Inventories & Orders | 0.05 | 0.02 | 0.16 | -0.13 | -0.15 | -0.25 | -0.06 |
by Robert Brusca March 22, 2010
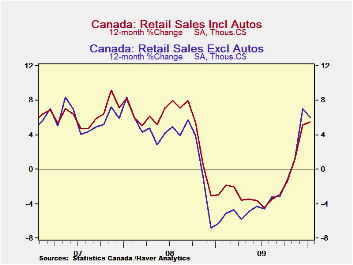
Canadian Retail sales rose a sharp 0.7% in January. Deflated by the CPI the retail sales rise comes back to a still respectable 0.4% gain. The year-over-year plot in the chart shows the acceleration in nominal retail sales is slowing. And that sort of thing is inevitable as growth rates climb. But it is also inevitable as recovery progresses and the recession gets pushed farther into history. In January the Yr/Yr gain is marked from January a year ago when sales rose by 1.7%. The December base for the year –over-year calculation is December 2009 when retail sales fell by 5% month-to-month. No wonder there is a noticeable backtracking there in the Yr/Yr rate of growth!
But the shorter sequential growth rate progression ( 3-M, 6-M 12-M) demonstrates that nominal sales growth has actually cooled over the past three-months compared to the 6-M and 12-M pace. On closer inspection that seems to have more to do with inflation as CPI-deflated retail sales accelerated to 3% over 6-months from 0.9% over 12 months and then to 3.9% over three months compared to six months. In the new quarter (2010-Q1) sales are rising at a 3.7% annual rate so the stronger growth rate seems to be mostly holding up.
The nominal sales data also show much more momentum in sales with motor vehicles excluded. The evidence there is of much stronger consumer spending in train. Retail less MV sales have accelerated from 5.5% over 12-months to 7.9% over 6-months to 10.1% over three months. In the current quarter the pace for sales is an even stronger 14%.
So there are various ways to assess the Canadian consumer. For the most part the consumer seems to be back to the store had shopping with gusto. Of course the Olympic Games came to Canada in February and so there could be a further boost to these figures at that time with the influx of tourists. For the moment, without the Olympic effect Canada’s consumers appear to be back on a spending path. Only auto purchases are lagging.
| Canada Retail Sales | ||||||||
|---|---|---|---|---|---|---|---|---|
| Mo/Mo | Saar | New QTR | ||||||
| Nominal % | Jan-10 | Dec-09 | Nov-09 | 3-Mo | 6-Mo | 12-MO | Yr-Ago | Saar |
| Total RTL | 0.7% | 0.5% | -0.4% | 3.5% | 6.0% | 6.0% | -6.3% | 5.7% |
| New Car Dealers | -2.3% | -0.4% | -2.3% | -18.2% | -0.6% | 10.6% | -19.5% | -18.3% |
| Supermarkets | 2.0% | -0.7% | 1.0% | 9.6% | 4.6% | 0.7% | 8.2% | 11.7% |
| Clothing Stores | 0.2% | 1.5% | -2.5% | -3.5% | 1.3% | -0.7% | -3.0% | 1.9% |
| Retail less MVs | 1.8% | 0.7% | 0.0% | 10.1% | 7.9% | 5.5% | -3.0% | 14.0% |
| CPI defalted Retail | 0.4% | 0.0% | 0.5% | 3.9% | 3.0% | 1.9% | 1.1% | 3.7% |
by Louise Curley March 22, 2010
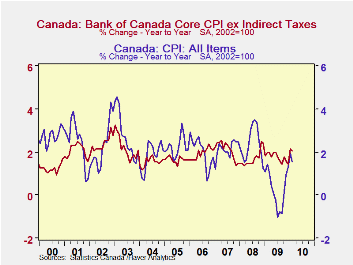
Canadian consumer prices, seasonally adjusted, increased 1.57% in February from a year ago. The core index showed a larger increase, 2.04%. The core index has been rising faster than the total index since November 2008, as can be seen in the first chart. The core index usually rises more slowly than the total index since the idea behind the core index is to exclude those items whose prices are particularly volatile, like food and energy. However, when the prices of such items decline faster that the general price level, the Core index will rise faster than the Total index. The second chart shows the sharp decline in the price of fuel oil and other fuels that took place from late 2008 until the summer of 2009. The rise since then suggests that sooner or later, the Total Index will be rising faster than the Core.
Buried in the extensive detail of the index is a component entitled Travel Accommodations that would not ordinarily cause comment, however, the rise of this component in February was striking as can be seen in the third chart. The rise was due apparently to increases in the prices of hotel rooms and other travel accommodations during the Olympics at Vancouver. The impact on the total index, was muted as the weight of the Travel Accommodation component is only 1.15%.
The actual indexes and the weights are found in the Haver Data Base, CANSIM.
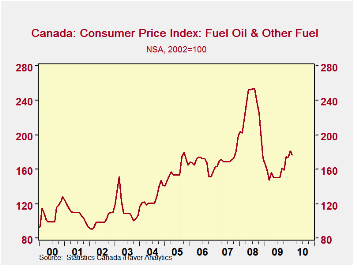
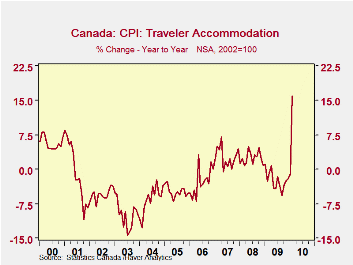
| Feb 10 | Jan 09 | Feb 09 | M/M Chg | Y/Y Chg | 2009 | 2008 | 2007 | |
|---|---|---|---|---|---|---|---|---|
| Total Index (SA, 2002=100) | 116.1 | 116.0 | 114.3 | 0.09 | 1.57 | 114.0 | 114.1 | 111.4 |
| Core Index (SA, 2002=100) | 115.3 | 114.9 | 113.0 | 0.35 | 2.04 | 113.6 | 111.7 | 109.8 |
| Total Index (NSA, 2002=100) | 115.6 | 115.1 | 113.8 | 0.42 | 1.58 | 114.4 | 114.1 | 111.5 |
| Fuel Oil and other Fuels | 176.0 | 181.6 | 157.6 | -3.08 | 11.68 | 158.0 | 225.4 | 122.5 |
| Travel Accommodations (NSA, 2002=100) | 87.8 | 74.0 | 75.7 | 18.65 | 15.98 | 79.7 | 81.8 | 79.8 |

Tom Moeller
AuthorMore in Author Profile »Prior to joining Haver Analytics in 2000, Mr. Moeller worked as the Economist at Chancellor Capital Management from 1985 to 1999. There, he developed comprehensive economic forecasts and interpreted economic data for equity and fixed income portfolio managers. Also at Chancellor, Mr. Moeller worked as an equity analyst and was responsible for researching and rating companies in the economically sensitive automobile and housing industries for investment in Chancellor’s equity portfolio. Prior to joining Chancellor, Mr. Moeller was an Economist at Citibank from 1979 to 1984. He also analyzed pricing behavior in the metals industry for the Council on Wage and Price Stability in Washington, D.C. In 1999, Mr. Moeller received the award for most accurate forecast from the Forecasters' Club of New York. From 1990 to 1992 he was President of the New York Association for Business Economists. Mr. Moeller earned an M.B.A. in Finance from Fordham University, where he graduated in 1987. He holds a Bachelor of Arts in Economics from George Washington University.
More Economy in Brief


