 Global| Feb 22 2010
Chicago Fed Index Increases ToNearly Highest Since 2007
by:Tom Moeller
|in:Economy in Brief
Summary
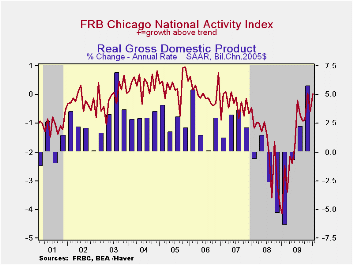
The U.S. economy regained forward momentum last month. The January Chicago Fed National Activity Index (CFNAI) from the Federal Reserve Bank of Chicago rose to a reading of 0.02 from a little-revised -0.58 in December. Also pointing [...]
 The
U.S.
economy regained forward momentum last month. The January Chicago Fed
National Activity Index (CFNAI) from the Federal Reserve Bank of
Chicago rose to a reading of 0.02 from a little-revised -0.58 in
December. Also pointing toward positive economic growth was the rise
from the series' low of -4.14 reached one year ago. During the last ten
years the has been a 76% correlation between the index level and the
q/q change in real GDP.
The
U.S.
economy regained forward momentum last month. The January Chicago Fed
National Activity Index (CFNAI) from the Federal Reserve Bank of
Chicago rose to a reading of 0.02 from a little-revised -0.58 in
December. Also pointing toward positive economic growth was the rise
from the series' low of -4.14 reached one year ago. During the last ten
years the has been a 76% correlation between the index level and the
q/q change in real GDP.
The three-month moving average of the index, which smoothes out some of the series' volatility, also rose to its highest level since 2007.
An index level at or below -0.70 typically has indicated negative U.S. economic growth. A zero value of the CFNAI indicates that the economy is expanding at its historical trend rate of growth of roughly 3.0%. The complete CFNAI report is available here.
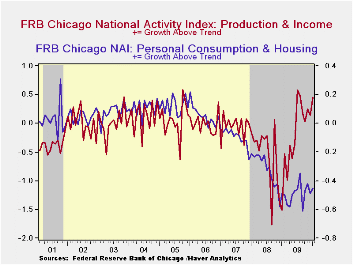
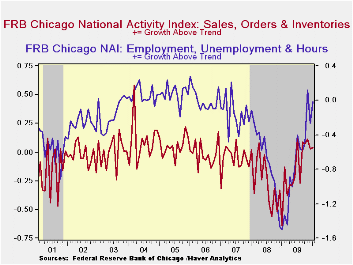
The Chicago Fed indicated that the production & income series made the largest positive contribution to the series improvement in January. Overall, 50 of the 85 individual indicators made positive contributions to the index while 35 made negative contributions. The CFNAI is a weighted average of 85 indicators of economic activity. The indicators reflect activity in the following categories: production & income, the labor market, personal consumption & housing, manufacturing & trade sales, and inventories & orders.· In a separate survey, the Chicago Fed indicated that its Midwest manufacturing index slipped during December but remained close to its highest level of the year. Indicators for the auto, steel, machinery and resource sectors were roughly unchanged. The Chicago Federal Reserve figures are available in Haver's SURVEYS database.
The Challenges Ahead is the title of N.Y. Federal Reserve Bank President William C. Dudley's comments and they are available here.
| Chicago Fed | January | December | November | 2009 | 2008 | 2007 |
|---|---|---|---|---|---|---|
| CFNAI | 0.02 | -0.58 | 0.06 | -1.64 | -1.79 | -0.35 |
| 3-Month Moving Average | -0.16 | -0.47 | -0.59 | -- | -- | -- |
| Personal Consumption & Housing | -0.45 | -0.49 | -0.42 | -0.49 | -0.32 | -0.09 |
| Employment, Unemployment & Hours | -0.01 | -0.26 | 0.12 | -0.76 | -0.67 | -0.15 |
| Production & Income | 0.45 | 0.14 | 0.25 | -0.23 | -0.56 | -0.05 |
| Sales, Inventories & Orders | 0.04 | 0.03 | 0.11 | -0.15 | -0.25 | -0.06 |
by Robert Brusca February 22, 2010
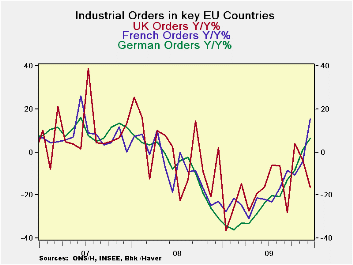
Germany no longer seems to be locked in to the wining trajectory that leads the e-Zone. France and Italy each have stronger orders growth than Germany Yr/Yr. Among the four largest EU nations Germany alone is the one with declining orders growth over the most recent three months on order declines in December and in October.
The UK shook off a steep decline in orders in November; that drop unwound a huge spike in orders in October. UK data have become extremely volatile. December has brought another outsized gain in orders this time of 8.5%. Despite some major league see-sawing the UK orders series appears to be in the same sort of rebound as Germany Italy and France.
The clear message from the chart above is that despite some period-to-period volatility in orders an upswing is still in train. Orders are climbing up out of the hole they were dug into during the recession. In November the large three EMU countries each had Yr/Yr declines in orders but in December orders in Italy, France and Germany all are in the plus column again for Yr/Yr growth.
| Selected Euro-Area and UK Industrial Orders | |||||||||
|---|---|---|---|---|---|---|---|---|---|
| Saar except m/m | Mo/Mo | Dec 09 |
Nov 09 |
Dec 09 |
Nov 09 |
Dec 09 |
Nov 09 |
||
| Countries: | Dec 09 |
Nov 09 |
Oct 09 |
3Mo | 3Mo | 6mo | 6mo | 12mo | 12mo |
| Germany (MFG): | -1.8% | 3.2% | -2.1% | -3.4% | 9.9% | 10.3% | 23.7% | 4.2% | -2.0% |
| France(Ind): | 17.1% | 0.5% | -8.2% | 36.4% | -7.3% | 40.5% | 4.5% | 15.5% | -4.2% |
| Italy (Ind): | 4.7% | 2.9% | 0.7% | 38.5% | 47.6% | 18.5% | 15.4% | 5.3% | -3.5% |
| UK (Engineering Industy): | 8.5% | -15.6% | 14.1% | 19.1% | -18.1% | 7.1% | -9.9% | -16.2% | -3.8% |
by Louise Curley February 22, 2010
 Taiwan
and
Thailand released fourth quarter Gross Domestic Product data this
morning. Taiwan is a small highly industrialized island
nation of about 7 million people with a per capita income of $16,428 in
2009 . Thailand, by contrast, is a large continental nation
of some 23 million people with a per capital income of $4,108 in
2008. Taiwan reported a fourth quarter increase of
4.23% and Thailand one of 3.6%.
Taiwan
and
Thailand released fourth quarter Gross Domestic Product data this
morning. Taiwan is a small highly industrialized island
nation of about 7 million people with a per capita income of $16,428 in
2009 . Thailand, by contrast, is a large continental nation
of some 23 million people with a per capital income of $4,108 in
2008. Taiwan reported a fourth quarter increase of
4.23% and Thailand one of 3.6%.
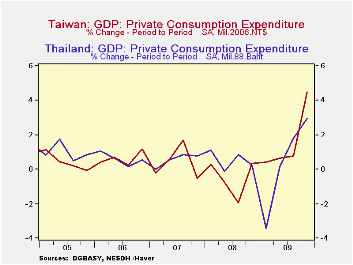
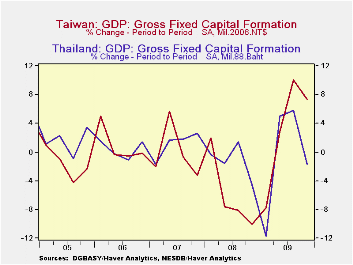
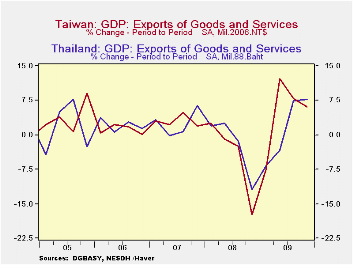
In Taiwan, although the rate of increase in the exports of good and service declined from 7.92% in the third quarter, it was still a respectable 6.08%. Private consumption, however, increased by 4.52% in the fourth quarter, compared with 0.77% in the third quarter. Fixed capital formation was up by 10.04% and inventory liquidation was sharply lower. Inventories have been cut back aggressively since the beginning of 2009. From declines 52,762, 29,881 and 75,142million 2006 NT$ in the third, second and first quarters of 2009 respectively, the fourth quarter saw a decline of only 2,555 million 2006 NT$.
In Thailand, exports of goods and service increased 7.69% in the fourth quarter, compared with 2.39% in the third quarter. Private consumption also accelerated, from 1.78% to 2.97%. Fixed investment, however, was 1.66% lower in the fourth quarter than in the third quarter and inventories were increased by 1,806 million '88 Bahts The inventory accumulation in the fourth quarter followed three previous quarters of liquidation. 17,367 mil 88 bahts in the third quarter, 910 in the second and 74,368 in the first quarter of 2009.
Quarterly changes in the major components of GDP for the two countries are shown in the accompanying charts and in the table below. Additional data for Taiwan and Thailand can be found in the Haver Data Base: EMERGEPR
| Q/Q Percent Changes (ex where noted) | Q4 09 |
Q3 09 |
Q2 09 |
Q1 09 |
Q4 08 |
Q3 08 |
Q2 08 |
Q1 08 |
|---|---|---|---|---|---|---|---|---|
| GDP: Taiwan | 4.23 | 2.45 | 4.25 | -2.55 | -3.62 | -3.62 | -0.33 | 1.26 |
| Thailand | 3.63 | 1.68 | 2.03 | -1.45 | -5.04 | -0.49 | -0.22 | 1.70 |
| Private Consumption: Taiwan | 4.52 | 0.77 | 0.65 | 0.39 | 0.38 | -1.192 | -0.78 | 0.30 |
| Thailand | 2.97 | 1.78 | 0.17 | -3.43 | 0.25 | 0.87 | -0.13 | 1.11 |
| Fixed Capital Formation: Taiwan | 10.07 | 7.68 | 22.38 | -30.52 | -10.46 | -2.31 | -8.93 | -7.20 |
| Thailand | -1.66 | 5.81 | 5.04 | -11.68 | -4.53 | 1.37 | -1.59 | -0.34 |
| Exports of Gds & Serv: Taiwan | 6.08 | 7.92 | 12.20 | -7.32 | -17.35 | -2.45 | -1.0 | 2.62 |
| Thailand | 7.69 | 2.39 | -3.40 | -6.66 | -11.90 | -1.33 | 2.52 | 1.96 |
| Chg in Inventories: Taiwan (Mil 2006NT$) | -2555 | -52762 | -29882 | -75142 | 37228 | 42424 | 25900 | 46269 |
| Thailand (mil 1988Bahts) | 1806 | -17367 | -910 | -74368 | 21240 | 30930 | -106 | 6497 |

Tom Moeller
AuthorMore in Author Profile »Prior to joining Haver Analytics in 2000, Mr. Moeller worked as the Economist at Chancellor Capital Management from 1985 to 1999. There, he developed comprehensive economic forecasts and interpreted economic data for equity and fixed income portfolio managers. Also at Chancellor, Mr. Moeller worked as an equity analyst and was responsible for researching and rating companies in the economically sensitive automobile and housing industries for investment in Chancellor’s equity portfolio. Prior to joining Chancellor, Mr. Moeller was an Economist at Citibank from 1979 to 1984. He also analyzed pricing behavior in the metals industry for the Council on Wage and Price Stability in Washington, D.C. In 1999, Mr. Moeller received the award for most accurate forecast from the Forecasters' Club of New York. From 1990 to 1992 he was President of the New York Association for Business Economists. Mr. Moeller earned an M.B.A. in Finance from Fordham University, where he graduated in 1987. He holds a Bachelor of Arts in Economics from George Washington University.
More Economy in Brief


