 Global| Oct 26 2009
Chicago Fed Index Dipped LastMonth But Trend Level Still Rising
by:Tom Moeller
|in:Economy in Brief
Summary
The Chicago Federal Reserve Bank indicated that while the U.S. economy had improved, growth was still below the historic trend. For September, the Chicago Fed National Activity Index (CFNAI) slipped m/m after having improved sharply [...]
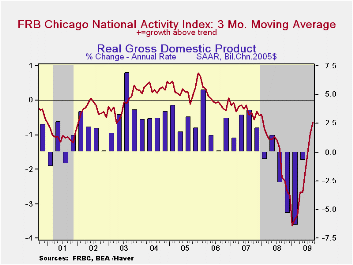 The Chicago Federal Reserve
Bank indicated that while the U.S.
economy had improved, growth was still below the historic trend. For
September, the Chicago Fed National Activity Index (CFNAI) slipped m/m
after having improved sharply from the January low. The reading of
-0.90 was down from -0.56 during August yet both readings were up
sharply from the series' low of -4.13 reached this past January. Since
1970 there has been a 74% correlation between the level of the index
and the q/q change in real GDP but during the last ten years that
correlation has risen to 80%.
The Chicago Federal Reserve
Bank indicated that while the U.S.
economy had improved, growth was still below the historic trend. For
September, the Chicago Fed National Activity Index (CFNAI) slipped m/m
after having improved sharply from the January low. The reading of
-0.90 was down from -0.56 during August yet both readings were up
sharply from the series' low of -4.13 reached this past January. Since
1970 there has been a 74% correlation between the level of the index
and the q/q change in real GDP but during the last ten years that
correlation has risen to 80%.
The three-month moving average which smoothes out some of the volatility of the index improved to its highest level since June of '08.
An index level at or below -0.70 typically has indicated negative U.S. economic growth. A zero value of the CFNAI indicates that the economy is expanding at its historical trend rate of growth of roughly 3%. The complete CFNAI report is available here.
The Chicago Fed indicated that 32 of the series' individual
indicators made positive contributions to the September index while 53
made negative contributions. The CFNAI is a weighted average of 85
indicators of economic activity. The indicators reflect activity in the
following categories: production & income, the labor market,
personal consumption & housing, manufacturing & trade
sales, and inventories & orders.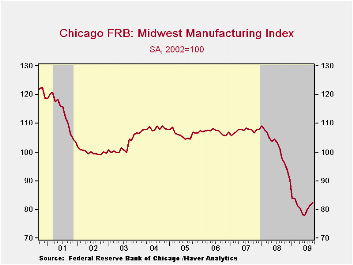
In a separate survey, the Chicago Fed indicated that its Midwest manufacturing index slipped during August but remained near its lowest since late-1993. Indicators for the steel, machinery and resource sectors improved modestly, however, that was outweighed by deterioration in the auto sector. The Chicago Federal Reserve figures are available in Haver's SURVEYS database.
International Perspective on the Crisis and Response is the title of Friday's speech by Fed Vice-Chairman Donald L. Kohn and it can be found here here
| Chicago Fed | September | August | July | August '08 | 2008 | 2007 | 2006 |
|---|---|---|---|---|---|---|---|
| CFNAI | -0.90 | -0.56 | -1.82 | -2.01 | -1.77 | -0.35 | 0.05 |
| 3-Month Moving Average | -1.09 | -1.61 | -2.15 | -1.42 | -- | -- | -- |
by Tom Moeller October 26, 2009
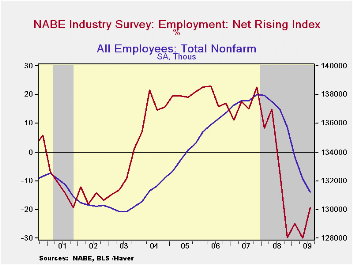
The National Association For Business Economics (NABE) indicated in its latest Industry Survey that U.S. economic conditions showed broad-based improvement during the last three months. That gain was paced by improvement in unit demand and profit margins.
 The net percentage of firms reporting higher demand rose to
23.4% which was the highest level in over one year. The improvement
came as 44.2% of firms indicated higher demand but only 20.8% showed
demand falling during 3Q. That was down from nearly half reporting
lower demand at the end of last year. Overall economic growth
through the end of next year is expected to average 3%.
The net percentage of firms reporting higher demand rose to
23.4% which was the highest level in over one year. The improvement
came as 44.2% of firms indicated higher demand but only 20.8% showed
demand falling during 3Q. That was down from nearly half reporting
lower demand at the end of last year. Overall economic growth
through the end of next year is expected to average 3%.
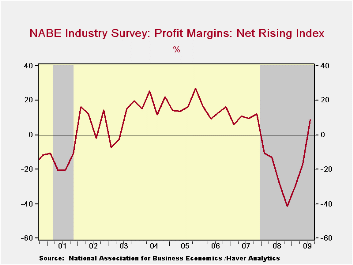
 Higher net-profit margins were indicated by firms for the
first time since the fourth quarter of 2007. Thirty-six percent of
firms indicated higher margins, up from 10% during 4Q08, while a
reduced 27% reported lower margins.
Higher net-profit margins were indicated by firms for the
first time since the fourth quarter of 2007. Thirty-six percent of
firms indicated higher margins, up from 10% during 4Q08, while a
reduced 27% reported lower margins.
While still negative, net-employment improved materially as 12% of firms reported higher employment, double the low of last quarter, and a much-reduced 31% reported lower hiring.
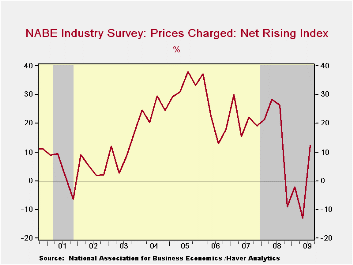 With the improvement in economic conditions, NABE indicated
that pricing power improved. The net-reading of 12% was the highest
level in one year as 23% reported higher prices and a reduced 11%
reported lower prices. Rising capital spending was indicated by firms
for the first time in one year as 26% showed higher spending while a
reduced 22% reported lower spending.
With the improvement in economic conditions, NABE indicated
that pricing power improved. The net-reading of 12% was the highest
level in one year as 23% reported higher prices and a reduced 11%
reported lower prices. Rising capital spending was indicated by firms
for the first time in one year as 26% showed higher spending while a
reduced 22% reported lower spending.
The NABE Industry Survey can be found in Haver's SURVEYS
database.
| Nat'l Assn. For Business Economics 3Q Industry Survey (Net Rising Index, %) | 3Q09 | 2Q09 | 1Q09 | 4Q08 |
|---|---|---|---|---|
| Unit Demand | 23.4 | -5.0 | -14.3 | -27.5 |
| Profit Margins | 8.7 | -17.0 | -30.4 | -41.2 |
| Employment | -19.2 | -30.0 | -25.0 | -29.8 |
| Prices Charged | 12.2 | -12.9 | -2.0 | -9.0 |
| Capital Spending | 4.2 | -23.6 | -15.8 | -26.0 |
by Robert Brusca October 26, 2009
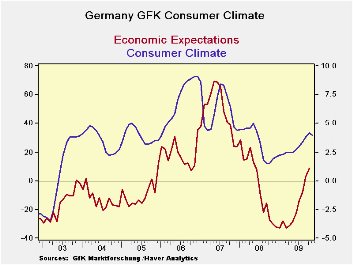
Germany’s GFK survey rose in October. It was a month-to-month
rise of 0.4 for the third month in a row. The economic index rose by
5.2 points its smallest rise since May but on the heels of a 10.9 point
spurt in September. Income expectations fell by 3.1 points, the first
drop in five months but after two large gains. The propensity to buy
dropped back by 10.4 points a huge drop and the largest since a drop of
15.7 in May 2008.
Still the Climate index at +4.2 is above its average of 3.3.
All of these components are above their average values since 2002. The
‘income’ and ‘propensity to buy’ percentiles are stronger for the count
percentiles than for the range percentiles; the standing among past
observations is stronger than their range standing between the highs
and lows. This means that while the current readings are still well off
peak they are in the upper part of the distribution of readings and in
the upper region of normal.
The GFK index shows that confidence is still improving in Germany. Germans are relatively more worried about the economy in generally than they are impacted by expectations for income or buying power problems. Still the fact of the matter is that German consumption has not been very strong. And Germany’s Chancellor is out warning that in 2011 there will be another crisis and that unemployment will rise from current levels. I guess that Obama’s pessimistic approach to assessing the economy is spreading abroad.
| Germany Consumer Climate Survey GFK | ||||
|---|---|---|---|---|
| Climate | Expectations | Propensity to | ||
| Economic | Income | Buy | ||
| Oct-09 | 4.2 | 8.7 | 12.9 | 26.1 |
| Sep-09 | 3.8 | 3.4 | 16.0 | 36.5 |
| Aug-09 | 3.4 | -7.5 | 8.8 | 31.1 |
| Jul-09 | 3.0 | -14.0 | 1.8 | 25.1 |
| Jun-09 | 2.7 | -22.6 | -3.3 | 14.5 |
| Average | 3.3 | 0.9 | -3.8 | -9.6 |
| Max | 9.1 | 69.5 | 33.6 | 64.4 |
| Min | -3.5 | -32.9 | -24.5 | -55.4 |
| % range | 61.1% | 40.6% | 64.4% | 68.0% |
| Count% | 59.6% | 66.0% | 92.6% | 87.2% |
| % range is current reading as a percentile of Hi/Low range | ||||
| Count % is current reading ranked as a %-tile among all readings | ||||
| GFK survey dates from January 2002 | ||||
by Louise Curley October 26, 2009
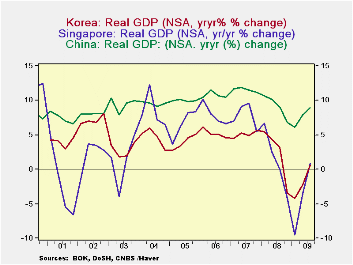 South Korean
joins China and Singapore among the emerging economies of the Pacific
Rim to report third quarter GDP. GDP growth in the three
countries is shown in the first chart. The declines in the
economies of Korea and Singapore have been much more severe than those
in China. China has not experienced a year to year decline in
GDP, merely a deceleration of growth. At their low points in
the first quarter of this year, GDP in Singapore was 9.5% below the
year ago figure and GDP in Korea, 4.3% below.
South Korean
joins China and Singapore among the emerging economies of the Pacific
Rim to report third quarter GDP. GDP growth in the three
countries is shown in the first chart. The declines in the
economies of Korea and Singapore have been much more severe than those
in China. China has not experienced a year to year decline in
GDP, merely a deceleration of growth. At their low points in
the first quarter of this year, GDP in Singapore was 9.5% below the
year ago figure and GDP in Korea, 4.3% below.
Korea reported that GDP grew 2.9% in the third quarter on a seasonally adjusted basis, compared with 2.7% in the second quarter. On a seasonally unadjusted basis, GDP was 0.6% above the year ago figure, the first positive figure since the third quarter of 2008.
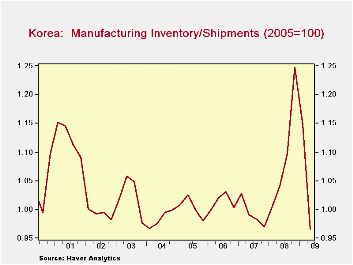 A swing in
inventories from a liquidation of 4,506 million won* in the
second quarter to an accumulation of 6,486 won in the third quarter was
the main factor in the third quarter strength. However, this
should not be a cause of concern at this point in the business
cycle. The rise follows three successive quarters of big
liquidations, beginning in the fourth quarter of 2008--7,290 million
won 6,788 million won and 4,506 million wan. The inventory to
shipments ratio for manufacturing at the end of the second quarter was
.97 down from 1.25 at the end of 2008. As can be seen in the
second chart, the I/S ratio for manufacturing was somewhat below normal
at the end of the second quarter so that a build up in the third
quarter is not unexpected.
A swing in
inventories from a liquidation of 4,506 million won* in the
second quarter to an accumulation of 6,486 won in the third quarter was
the main factor in the third quarter strength. However, this
should not be a cause of concern at this point in the business
cycle. The rise follows three successive quarters of big
liquidations, beginning in the fourth quarter of 2008--7,290 million
won 6,788 million won and 4,506 million wan. The inventory to
shipments ratio for manufacturing at the end of the second quarter was
.97 down from 1.25 at the end of 2008. As can be seen in the
second chart, the I/S ratio for manufacturing was somewhat below normal
at the end of the second quarter so that a build up in the third
quarter is not unexpected.
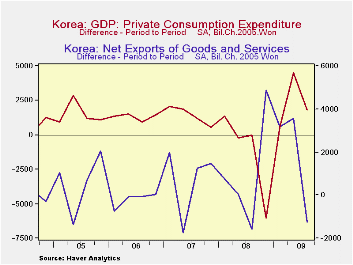 The
performance of the other components of
GDP was generally typical of that seen in the early stages of
recovery--some increases and some retrenchments. The one
notable exception was a greater decline in exports of goods and
services, than that in imports of goods and services, with the result
that the balance on goods and services declined from 20.3 billion won
in the second quarter to 19.1 billion won . In the past,
exports have been a dynamic element in the growth of the Korean economy
and generally quick to respond to improvements in the world economy.
Private consumption increased by 3,524.7 million won in the third
quarter compared with an increase of 1,367.1, this could be an sign
that Korea is beginning to shift away from its policy of export led
growth but it is probably not too wise to base a conclusion on one
quarter's evidence. See the third chart. There were small
declines in construction, fixed investment in intangible
assets and government consumption and the change in business investment
in plant and equipment was essentially unchanged at 1,778 million won
in the third quarter, compared with a rise of 1,846 million won in the
second quarter.
The
performance of the other components of
GDP was generally typical of that seen in the early stages of
recovery--some increases and some retrenchments. The one
notable exception was a greater decline in exports of goods and
services, than that in imports of goods and services, with the result
that the balance on goods and services declined from 20.3 billion won
in the second quarter to 19.1 billion won . In the past,
exports have been a dynamic element in the growth of the Korean economy
and generally quick to respond to improvements in the world economy.
Private consumption increased by 3,524.7 million won in the third
quarter compared with an increase of 1,367.1, this could be an sign
that Korea is beginning to shift away from its policy of export led
growth but it is probably not too wise to base a conclusion on one
quarter's evidence. See the third chart. There were small
declines in construction, fixed investment in intangible
assets and government consumption and the change in business investment
in plant and equipment was essentially unchanged at 1,778 million won
in the third quarter, compared with a rise of 1,846 million won in the
second quarter.
*The won in all cases is the 2005 chained won.
| SOUTH KOREA | Q3 09 | Q2 09 | Q1 09 | Q4 08 | Q3 08 | Q2 08 | Q1 08 | 2008 | 2007 |
|---|---|---|---|---|---|---|---|---|---|
| GDP | |||||||||
| Q/Q Change (SA) | 2.93 | 2.65 | 0.12 | -5.07 | 0.22 | 0.43 | 1.00 | 2.22 | 5.11 |
| Y/Y Change (NSA) | 0.58 | -2.16 | -425 | -3.40 | 3.11 | 4.35 | 5.46 | 2.22 | 5.11 |
| Change in New Exports (Mil. 2005 Chained Won) | -1263 | 3572 | 3175 | 4876 | -1590 | 48 | 756 | 10019 | 6577 |
| Change in Inventory Change " | 6487 | -4506 | -6788 | -7290 | 1396 | 467 | 2004 | 7752 | -2815 |
| Change in Private Consumption " | 3525 | 1367 | -880 | -3189 | 1648 | -3364 | -25 | 4703 | 24655 |

Tom Moeller
AuthorMore in Author Profile »Prior to joining Haver Analytics in 2000, Mr. Moeller worked as the Economist at Chancellor Capital Management from 1985 to 1999. There, he developed comprehensive economic forecasts and interpreted economic data for equity and fixed income portfolio managers. Also at Chancellor, Mr. Moeller worked as an equity analyst and was responsible for researching and rating companies in the economically sensitive automobile and housing industries for investment in Chancellor’s equity portfolio. Prior to joining Chancellor, Mr. Moeller was an Economist at Citibank from 1979 to 1984. He also analyzed pricing behavior in the metals industry for the Council on Wage and Price Stability in Washington, D.C. In 1999, Mr. Moeller received the award for most accurate forecast from the Forecasters' Club of New York. From 1990 to 1992 he was President of the New York Association for Business Economists. Mr. Moeller earned an M.B.A. in Finance from Fordham University, where he graduated in 1987. He holds a Bachelor of Arts in Economics from George Washington University.
More Economy in Brief


