 Global| Jun 06 2006
Chain Store Sales Stabilize
by:Tom Moeller
|in:Economy in Brief
Summary
The International Council of Shopping Centers (ICSC)-UBS reported that chain store sales stabilized last week and ticked 0.1% higher following two weeks of sharp decline. As a result of w/w declines during May, sales in the opening [...]
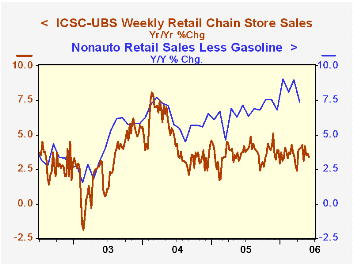
The International Council of Shopping Centers (ICSC)-UBS reported that chain store sales stabilized last week and ticked 0.1% higher following two weeks of sharp decline.
As a result of w/w declines during May, sales in the opening week of June were 1.0% below the May average which fell 0.4% from April. During the last ten years there has been a 47% correlation between the y/y change in chain store sales and the change in nonauto retail sales less gasoline.The ICSC-UBS retail chain-store sales index is constructed using the same-store sales (stores open for one year) reported by 78 stores of seven retailers: Dayton Hudson, Federated, Kmart, May, J.C. Penney, Sears and Wal-Mart.
The leading indicator of chain store sales from ICSC-UBS rose for the first time since early March. A 0.2% increase nevertheless left the series down 2.5% versus one year ago and 4.1% from the recent peak in January.
Comments on the Outlook for the U.S. Economy and Monetary Policy, remarks by Chairman Ben S. Bernanke
at the International Monetary Conference in Washington, D.C. can be found here.
| ICSC-UBS (SA, 1977=100) | 06/03/06 | 05/27/06 | Y/Y | 2005 | 2004 | 2003 |
|---|---|---|---|---|---|---|
| Total Weekly Chain Store Sales | 468.1 | 467.5 | 3.4% | 3.6% | 4.7% | 2.9% |
by Tom Moeller June 6, 2006
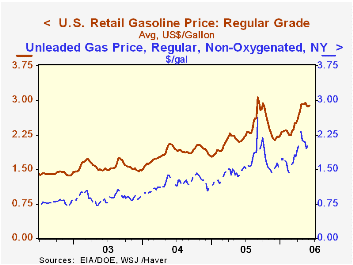
Retail gasoline prices rose two cents last week to $2.89 per gallon (36.7% y/y). The rise left gas prices in early June off just slightly from an average $2.91 during May.
The spot market price for regular unleaded gasoline rose eight cents yesterday and that added to a four cent increase on Friday. As a result, the spot price at $2.09 per gallon in early June is up from $2.04 averaged during May.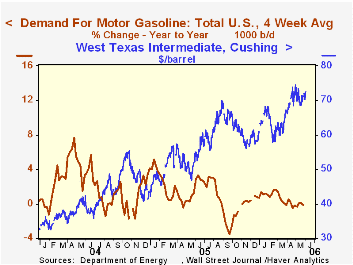
The price of West Texas Intermediate crude oil also moved up yesterday to $72.60 per barrel versus $70.94 averaged during May.
Demand for gasoline demand has begun its usual seasonal rebound. During the last four weeks the demand for gasoline is up 5.0% versus a January low. That increase, however, is somewhat less than the 6-9% recoveries during early 2004 and early 2005. As a result, the four week average of gasoline demand versus the year ago level was roughly unchanged (-0.1%).
The latest Short-Term Energy and Summer Fuels Outlook from the U.S. Energy Information Administration can be found here.
| US Weekly | 06/05/06 | 05/29/06 | Y/Y | 2005 | 2004 | 2003 |
|---|---|---|---|---|---|---|
| U.S. Retail Gasoline, Regular per Gal. | $2.89 | $2.87 | 36.7% | $2.27 | $1.85 | $1.56 |
by Tom Moeller June 6, 2006
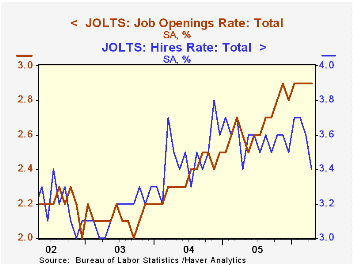
The April job openings rate as reported by the Bureau of Labor Statistics in the Job Openings & Labor Turnover Survey (JOLTS) was unchanged at 2.9%, where it has been all year. The job openings rate is the number of job openings on the last business day of the month as a percent of total employment plus job openings.
The actual number of job openings, however, ticked 0.1% higher to 4.095 million. That added to strong monthly gains earlier in the year and pulled the number of openings up 14.1% y/y.
Moving in the other direction the hires rate fell to 3.4%, the lowest level in a year, from 3.6% in March. The hires rate is the number of hires during the month divided by employment. The actual number of hires fell a sharp 7.0% (-0.7% y/y) after a 1.4% March decline.
The job separations rate fell to 3.3% from 3.5% in March and 3.4% in February. Separations include quits, layoffs, discharges, and other separations as well as retirements. The total separations, or turnover, rate is the total number of separations during the month divided by employment. The level of job separations dropped 5.6% (-4.2% y/y) to 4.419 million.
The survey dates only to December 2000 but has since followed the movement in nonfarm payrolls.
A description of the Jolts survey and the latest release from the U.S. Department of Labor is available here.
| JOLTS (Job Openings & Labor Turnover Survey) | April | March | April '05 | 2005 | 2004 | 2003 |
|---|---|---|---|---|---|---|
| Job Openings Rate: Total | 2.9% | 2.9% | 2.6% | 2.7% | 2.4% | 2.1% |
| Hires Rate: Total | 3.4% | 3.6% | 3.4% | 3.6% | 3.5% | 3.2% |
by Louise Curley June 6, 2006
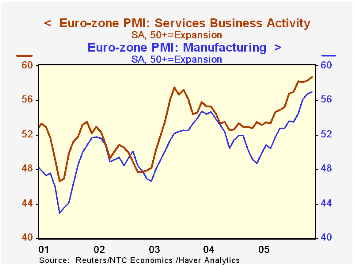
Like the NTC Economics Ltd. surveys of the intentions of purchasing managers in the manufacturing industries, that Carol Stone commented on last week, theMay survey of purchasing managers in the service industries is another sign of more growth to come in the Euro Zone despite rising oil prices and a strong euro.Growth has been stronger in the service industries than in the manufacturing as can be seen in the first chart.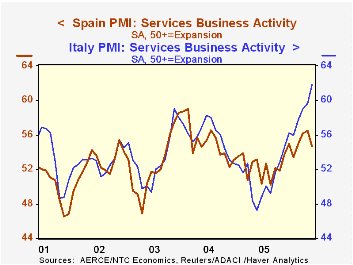
For the Euro Zone, as a whole, the index rose to 58.69 in May from 58.33 in April. This is the highest value since November, 2003. (A value over 50 indicates expansion, one under 50, contraction.) PMI's are not available for all the individual members of the Euro Zone. For the service industries, only data for France, Germany, Ireland, Italy and Spain are available. Although the over-all index for the Euro Zone increased in May, the indexes for Spain and Germany fell. Some of the variations in purchasing managers intentions over the past year can be seen in the second chart. The intentions of purchasing managers in Italy have increased steadily and sharply over the past year while those in Spain have increased at slower rate and have had a more erratic path.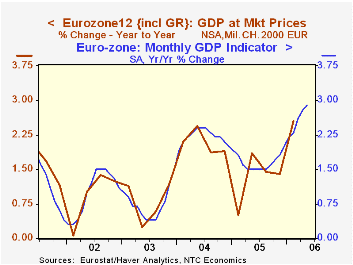
In addition to the purchasing managers intentions, NTC Economics also publishes monthly GDP Indicators for selected countries and areas. These indicators are based on the data collected in the surveys of the intentions of the purchasing managers in the manufacturing, service and construction industries. In the latest surveys, the indicators point to a 2.9% year-over-year growth for the Euro Zone. This indicator has been a fairly good predictor of GDP growth as can be seen in the third chart.
| PMI Survey of Service Industries >50=Growth <50=Contraction | May 06 | Apr 06 |
|---|---|---|
| Euro Zone | 58.69 | 58.33 |
| France | 60.58 | 59.39 |
| Germany | 56.67 | 57.25 |
| Ireland | 66.16 | 65.58 |
| Italy | 61.82 | 59.63 |
| Spain | 54.69 | 56.49 |

Tom Moeller
AuthorMore in Author Profile »Prior to joining Haver Analytics in 2000, Mr. Moeller worked as the Economist at Chancellor Capital Management from 1985 to 1999. There, he developed comprehensive economic forecasts and interpreted economic data for equity and fixed income portfolio managers. Also at Chancellor, Mr. Moeller worked as an equity analyst and was responsible for researching and rating companies in the economically sensitive automobile and housing industries for investment in Chancellor’s equity portfolio. Prior to joining Chancellor, Mr. Moeller was an Economist at Citibank from 1979 to 1984. He also analyzed pricing behavior in the metals industry for the Council on Wage and Price Stability in Washington, D.C. In 1999, Mr. Moeller received the award for most accurate forecast from the Forecasters' Club of New York. From 1990 to 1992 he was President of the New York Association for Business Economists. Mr. Moeller earned an M.B.A. in Finance from Fordham University, where he graduated in 1987. He holds a Bachelor of Arts in Economics from George Washington University.
More Economy in Brief


