 Global| Jun 07 2005
Chain Store Sales Recovered Some Last Week
by:Tom Moeller
|in:Economy in Brief
Summary
Chain store sales rose a modest 0.4% during the opening week of June following three consecutive periods of decline according to the International Council of Shopping Centers (ICSC)-UBS survey. The slim increase left sales 0.7% below [...]
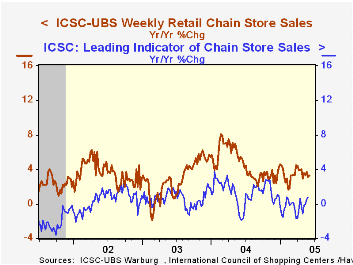
Chain store sales rose a modest 0.4% during the opening week of June following three consecutive periods of decline according to the International Council of Shopping Centers (ICSC)-UBS survey. The slim increase left sales 0.7% below the May average which rose 0.3% versus April.
During the last ten years there has been a 56% correlation between the y/y change in chain store sales and the change in non-auto retail sales less gasoline, as published by the US Census Department. Chain store sales correspond directly with roughly 14% of non-auto retail sales less gasoline.
The leading indicator of chain store sales from ICSC slipped 0.3% w/w (+0.8% y/y), the first decline in four weeks.
The ICSC-UBS retail chain-store sales index is constructed using the same-store sales (stores open for one year) reported by 78 stores of seven retailers: Dayton Hudson, Federated, Kmart, May, J.C. Penney, Sears and Wal-Mart.
Last night's remarks by Fed Chairman Alan Greenspan are available here.
Battle at Bond Bluff: Forecasters vs. Financial Markets from the Federal Reserve Bank of St. Louis can be found here.
| ICSC-UBS (SA, 1977=100) | 06/04/05 | 05/28/05 | Y/Y | 2004 | 2003 | 2002 |
|---|---|---|---|---|---|---|
| Total Weekly Chain Store Sales | 452.9 | 451.2 | 3.3% | 4.6% | 2.9% | 3.6% |
by Tom Moeller June 7, 2005
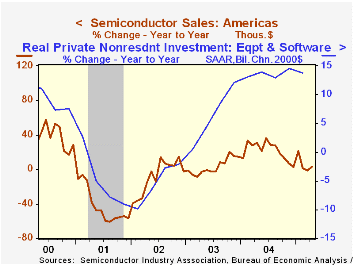
April sales of semiconductors in the Americas as published by the Semiconductor Industry Association fell a sharp 21.1% following a like increase the month prior. This sideways movement in American sales of semis has been in place for roughly a year.
American sales of semiconductors account for 18% of the worldwide total, about half the percentage in 2000. Sales growth in the Asia/Pacific region averaged 41.3% last year, twice the American average, while sales in Japan rose 17.5%. The Asia/Pacific region currently accounts for just under one half of worldwide sales of semiconductors, up from less than one quarter in 2000.
During the last ten years there has been a 66% correlation between the y/y change in American sales of semiconductors and the change in real U.S. investment in equipment & software.
| Semiconductor Sales | April | March | Y/Y | 2004 | 2003 | 2002 |
|---|---|---|---|---|---|---|
| Worldwide | $16.679B | $20.556B | 4.7% | 28.0% | 18.3% | 1.3% |
| Americas | $2.920B | $3.701B | 3.8% | 20.8% | 3.4% | -12.6% |
by Louise Curley June 7, 2005
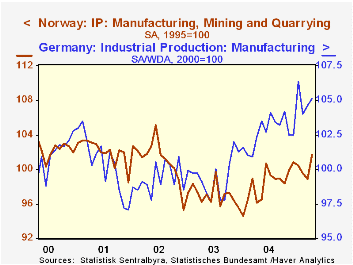
Industrial production data for April were released today for Germany, Norway, Brazil and Hungary--a large and a small developed economy and a large and a small emerging economy.
The first chart compares the trend in manufacturing production for Germany and Norway. Indexes for manufacturing rather than the total are used as the total indexes for these countries are particularly erratic, including such volatile industries as construction in Germany and oil and gas extraction and mining and quarrying in Norway. For instance, the increase in the total index for Germany was 1.1% from March to April but after excluding the 18.6% rise in construction, manufacturing was up only 0.5%. In Norway the total was up 4.7%, but excluding the rise of 6.3% in oil and gas extraction and of 17.9% in mining and quarrying, up, manufacturing was up only 2.2% Production has increased in recent months in both countries, but there has been no strong trend since 2000. 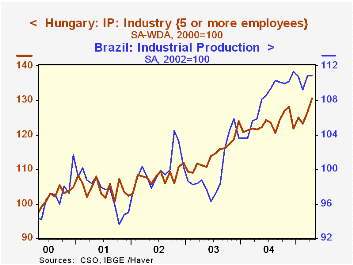
In contrast industrial production in the two emerging market countries has been in a strong uptrend since 2000 as can be seen in the second chart. While index numbers tell us nothing of magnitudes, they do reveal changes in the levels of production. To make it easier to compare the growth in production in the four countries we have adjusted the figures for Norway and Brazil, putting both on a bases of 2000 =100. The official Norway data are based on 1995=100 and those for Brazil, on 2002=100. These calculations are shown in the table below.
Currently production in the emerging market economies is well above 2000 levels--some 15% in Brazil and 30% in Hungary while manufacturing production in Norway is slightly below the level of 2000 and in Germany, only slightly above. Production in Brazil is beginning to falter, but production in Hungary is still strong.
| Industrial Production | Apr 05 | Mar 05 | M/M% | Y/Y% | 2004 | 2003 | 2002 |
|---|---|---|---|---|---|---|---|
| Germany Mfg 2000=100 | 105.1 | 104.6 | 0.48 | 2.64 | 102.7 | 99.5 | 99.3 |
| Norway Mfg 2000=100 Computed | 98.4 | 96.2 | 2.22 | 5.63 | 95.3 | 93.9 | 98.1 |
| Norway Mfg 1995 =100 Official | 101.4 | 99.2 | 2.22 | 5.63 | 98.2 | 96.8 | 101.1 |
| Hungary 2000=100 | 130.50 | 126.58 | 3.10 | 7.26 | 123.10 | 114.37 | 107.82 |
| Brazil 2000=100 Computed | 115.69 | 115.79 | -0.04 | 4.68 | 112.78 | 104.37 | 104.37 |
| Brazil 2002=100 Official | 110.84 | 110.88 | -0.04 | 4.68 | 108.05 | 100.0 | 100.0 |

Tom Moeller
AuthorMore in Author Profile »Prior to joining Haver Analytics in 2000, Mr. Moeller worked as the Economist at Chancellor Capital Management from 1985 to 1999. There, he developed comprehensive economic forecasts and interpreted economic data for equity and fixed income portfolio managers. Also at Chancellor, Mr. Moeller worked as an equity analyst and was responsible for researching and rating companies in the economically sensitive automobile and housing industries for investment in Chancellor’s equity portfolio. Prior to joining Chancellor, Mr. Moeller was an Economist at Citibank from 1979 to 1984. He also analyzed pricing behavior in the metals industry for the Council on Wage and Price Stability in Washington, D.C. In 1999, Mr. Moeller received the award for most accurate forecast from the Forecasters' Club of New York. From 1990 to 1992 he was President of the New York Association for Business Economists. Mr. Moeller earned an M.B.A. in Finance from Fordham University, where he graduated in 1987. He holds a Bachelor of Arts in Economics from George Washington University.
More Economy in Brief


