 Global| Nov 07 2006
Chain Store Sales Recover
by:Tom Moeller
|in:Economy in Brief
Summary
Chain store sales last week recovered much of the declines during the prior two weeks with a 1.0% gain, according to the International Council of Shopping Centers (ICSC)-UBS. That pulled the opening level of sales in November 0.4% [...]
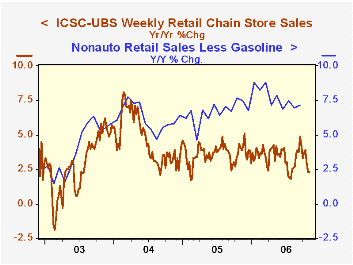
The ICSC-UBS retail chain-store sales index is constructed using the same-store sales (stores open for one year) reported by 78 stores of seven retailers: Dayton Hudson, Federated, Kmart, May, J.C. Penney, Sears and Wal-Mart.
The leading indicator of chain store sales from ICSC-UBS fell 0.4% (+0.2% y/y) last week after an unchanged reading the prior period.
A Theory of Political Cycles from the Federal Reserve Bank of Richmond can be found here.
Politics and Exchange Rate Forecasts from the Federal Reserve Bank of Kansas City is available here.
| ICSC-UBS (SA, 1977=100) | 11/04/06 | 10/28/06 | Y/Y | 2005 | 2004 | 2003 |
|---|---|---|---|---|---|---|
| Total Weekly Chain Store Sales | 466.4 | 461.8 | 2.3% | 3.6% | 4.7% | 2.9% |
by Tom Moeller November 7, 2006
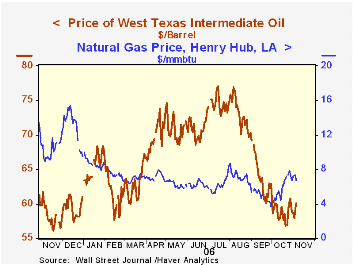 Natural gas prices eased d/d yesterday to $6.75 per mmbtu (-24.0% y/y) but the Henry Hub price still was up from an average of $5.77 in October and $4.90 during September.
The Department of Energy reported that gasoline demand during the latest four weeks rose 5.0% from the year earlier period. That increase, however, understated the appetite for gasoline according to estimated figures from the Oil & Gas Journal which indicated a 15.5% rise. These figures are available in the Haver OILWKLY database.
Natural gas prices eased d/d yesterday to $6.75 per mmbtu (-24.0% y/y) but the Henry Hub price still was up from an average of $5.77 in October and $4.90 during September.
The Department of Energy reported that gasoline demand during the latest four weeks rose 5.0% from the year earlier period. That increase, however, understated the appetite for gasoline according to estimated figures from the Oil & Gas Journal which indicated a 15.5% rise. These figures are available in the Haver OILWKLY database.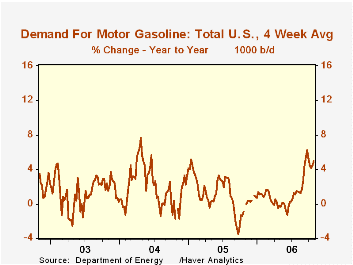 The latest Short-Term Energy Outlook from the U.S. Energy Information Administration is available here.
Oil Prices and the U.S. Trade Deficit from the Federal Reserve Bank of San Francisco is available here.
| Weekly Energy Prices | 11/06/06 | 10/30/06 | Y/Y | 2005 | 2004 | 2003 |
|---|---|---|---|---|---|---|
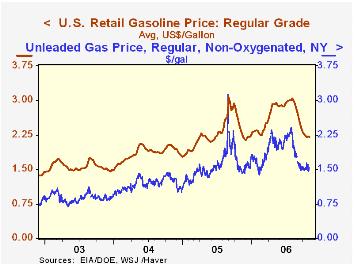
| US Retail Gasoline Price, Regular | $2.20 | $2.22 | -7.4% | $2.27 | $1.85 | $1.56 |
by Louise Curley November 7, 2006
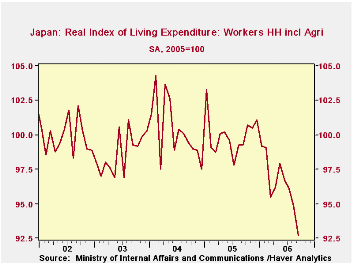
By the many measures of family living expenditures the Ministry of Internal Affairs and Communications publishes, Japanese families have been reducing their living expenditures. The index of living expenditures for all households in Japan declined 2.8% in September. Those of worker households declined 3.35%. On seasonally adjusted bases, all households reduced spending on average in September by 1.97% in real terms and 2.16% in nominal terms.Comparable declines for the worker households were 2.42% and 2.32%. The September declines have, in most cases followed declines in August and July. The first chart showing the seasonally adjusted real living expenditure by all households is illustrative of declines in the various measures of household living expenditures over the recent quarter. In addition to the various indexes, data in yen are also available.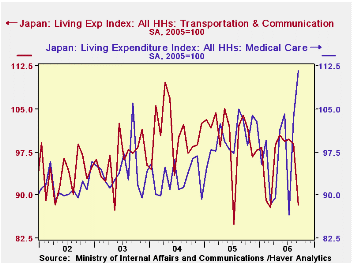
The seasonally unadjusted data give details of the composition of expenditures. For example, in September, expenditures on food, fuel, light and water charges, medical care, education and culture all rose while expenditures on housing, furniture and household utensils, clothing and foot ware, transportation and communication and miscellaneous all declined. The second chart shows expenditures on medical care and transportation,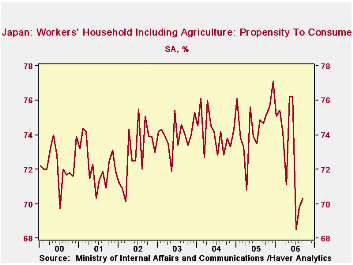
In addition to the seasonally adjusted data on expenditures, data are also available on income, disposable income and the propensity to consume. The propensity to consume for all households increased in August and September, in spite of the decline in expenditures since the decline in disposable income was greater than the decline in living expenditures. Even with the rise, the propensity to consume is still at a historically low level as can be seen in the third chart.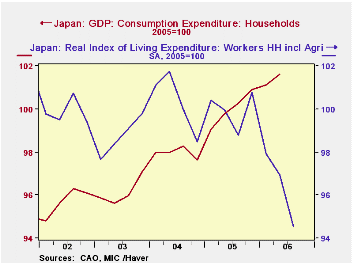
One would think that the living expenditure series might be a good indicator of consumer spending in the national accounts. The relationship, however, appears tenuous as can be seen in the fourth chart that compares the seasonally adjusted real living expenditures of all households with final consumption expenditures in GDP. Nevertheless, the recent trend in the real living expenditures looks ominous. (To compare the two series, we aggregated the monthly data of the living expenditure series on a quarterly basis and we put the Consumption data on an index with the same basis--(2005=100)--as the living expenditure series.
| Japan: Family Living Expenditures (2005=100) | Sep 06 | Aug 06 | Sep 05 | M/M % | Y/Y % | 2005 | 2004 | 2003 |
|---|---|---|---|---|---|---|---|---|
| All Households NSA | 94.0 | 96.7 | 100.3 | -2.79 | -6.28 | 100.0 | 100.1 | 99.6 |
| Worker Households NSA | 92.3 | 95.5 | 99.2 | -3.35 | -6.96 | 100.0 | 99.8 | 98.5 |
| All Household SA | -- | -- | -- | -- | -- | -- | -- | -- |
| Real | 94.5 | 96.4 | 100.5 | -1.97 | -5.97 | 100.0 | 100.5 | 100.0 |
| Nominal | 95.2 | 97.3 | 100.5 | -2.16 | -5.27 | 100.0 | 100.8 | 100.4 |
| Worker Household SA | -- | -- | -- | -- | -- | -- | -- | -- |
| Real | 92.7 | 94.9 | 99.3 | -2.32 | -6.65 | 100.0 | 100.3 | 98.7 |
| Nominal | 93.2 | 95.5 | 99.1 | -2.41 | -5.95 | 100.0 | 100.7 | 99.1 |
| Propensity to Consume All HH (Nominal SA)(%) | 70.3 | 69.8 | 74.7 | 0.5* | -4.4* | 74.5 | 74.1 | 74.0 |

Tom Moeller
AuthorMore in Author Profile »Prior to joining Haver Analytics in 2000, Mr. Moeller worked as the Economist at Chancellor Capital Management from 1985 to 1999. There, he developed comprehensive economic forecasts and interpreted economic data for equity and fixed income portfolio managers. Also at Chancellor, Mr. Moeller worked as an equity analyst and was responsible for researching and rating companies in the economically sensitive automobile and housing industries for investment in Chancellor’s equity portfolio. Prior to joining Chancellor, Mr. Moeller was an Economist at Citibank from 1979 to 1984. He also analyzed pricing behavior in the metals industry for the Council on Wage and Price Stability in Washington, D.C. In 1999, Mr. Moeller received the award for most accurate forecast from the Forecasters' Club of New York. From 1990 to 1992 he was President of the New York Association for Business Economists. Mr. Moeller earned an M.B.A. in Finance from Fordham University, where he graduated in 1987. He holds a Bachelor of Arts in Economics from George Washington University.
More Economy in Brief


