 Global| May 25 2010
Case-Shiller Home Price IndexImproves Y/Y But Momentum Eases
by:Tom Moeller
|in:Economy in Brief
Summary
The recent improvement in home sales has not enhanced pricing power by much, but at least it's ended earlier declines. Seasonally adjusted, the Case-Shiller Home Price Index slipped just marginally from February. That capped a 3.7% [...]
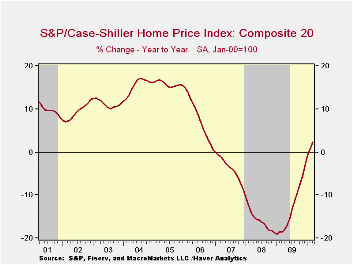
The recent improvement in home sales has not enhanced pricing power by much, but at least it's ended earlier declines. Seasonally adjusted, the Case-Shiller Home Price Index slipped just marginally from February. That capped a 3.7% rise in prices since last May's low following double-digit, y/y price declines dating back to early-2008. Overall, home prices have fallen 29.8% since the April 2006 peak.
The narrower 10 City Composite Index rose a seasonally adjusted 0.2%. Over the last year prices rose 1.5% and they're up 4.6% since the low during May of last year.
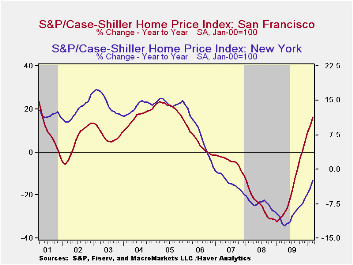
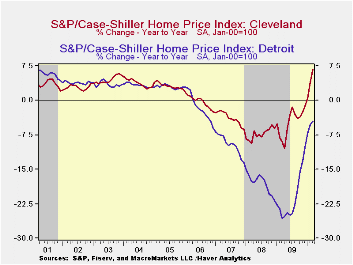
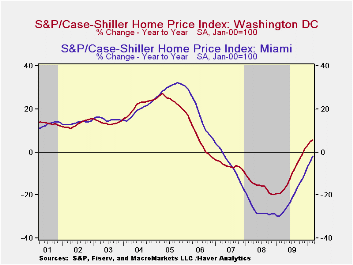
The performance of home prices continued to vary around the country. During March the 12-month gain in prices was strongest in the West where in San Francisco they rose 16.3% and in San Diego by 10.8%. Lesser price gains were logged in Los Angeles (6.1%) and Denver (4.1%). Prices also rose in Cleveland (6.7%) Minneapolis (6.6%), Washington D.C. (5.7%), Boston (3.9%), Dallas (3.1%) and Phoenix (2.5%). Widespread, though lessened, price declines continued in Detroit (-4.5%), Charlotte (-3.9%), Seattle (-3.5%), Portland (-2.7%), New York (-2.4%) and Atlanta (-1.2%).
The Case-Shiller home price series are value-weighted, i.e., a greater index weight is assigned to more expensive homes. The S&P/Case-Shiller home price series can be found in Haver's USECON database and the city data highlighted below is in the REGIONAL database.
| S&P/Case-Shiller Home Price Index (SA) | March m/m | February m/m | January m/m | March y/y | 2009 | 2008 | 2007 |
|---|---|---|---|---|---|---|---|
| 20 City Composite Index | -0.0 | -0.1 | 0.3 | 2.4 | -13.3 | -15.7 | -3.8 |
| Regional Indicators | |||||||
| Atlanta | -1.3 | -0.7 | -0.6 | -1.2 | -11.6 | -8.5 | 0.7 |
| Boston | 0.3 | -0.4 | 0.3 | 3.9 | -4.9 | -5.7 | -4.0 |
| Chicago | -2.0 | -1.1 | -0.5 | -2.2 | -14.2 | -10.0 | -1.0 |
| Dallas | 0.3 | -1.3 | -0.3 | 3.1 | -2.3 | -3.3 | 0.5 |
| Denver | 0.5 | -0.0 | -0.1 | 4.1 | -2.8 | -4.9 | -1.7 |
| Los Angeles | -0.3 | 0.1 | 1.9 | 6.1 | -15.4 | -24.2 | -5.2 |
| New York | -0.1 | -0.1 | -0.2 | -2.4 | -9.8 | -7.4 | -2.8 |
| San Francisco | 0.9 | 0.4 | 0.6 | 16.3 | -18.4 | -24.3 | -4.5 |
| Tampa | -0.0 | -0.3 | 0.3 | -3.5 | -18.8 | -19.2 | -7.6 |
by Tom Moeller May 25, 2010

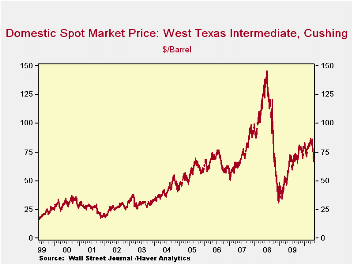
The coming summer driving season hasn't helped U.S. gasoline prices as they've dipped from recent highs. Petroleum prices generally weakened with evidence that forward economic momentum, globally, has lost steam. Those worries lowered the pump price of regular gasoline to $2.79 last week yet prices remained up more than three-quarters since the December 2008 low. Yesterday the spot market price for a gallon of regular gasoline fell further from last week's average. The figures are reported by the U.S. Department of Energy and can be found in Haver's WEEKLY & DAILY databases.
Lower crude oil costs have very much reflected these concerns over the worldwide economic recovery. The average price for a barrel of light sweet crude (WTI) fell last week to $69.02 versus the recent high of $84.23 averaged during April. Yesterday, crude prices fell further to $66.88 per barrel.
Demand for gasoline hasn't yet much reflected the prospects for economic weakness. It rose 1.6% last week versus one year ago. That compares to a 3.0% decline in early-February. The demand for residual fuel oil rose a lesser 7.7% and distillate demand surged 9.3% y/y. That's improved from a 12.3% decline during February. Inventories of crude oil and petroleum products improved into May but still were up just a modest 0.2% from one year ago.
U.S. natural gas prices strengthened last week to an average $4.25 per mmbtu (2.9% y/y). Prices reached a high of $6.50 early in January. Nevertheless, prices remained nearly double the September low.
The energy price data can be found in Haver's WEEKLY database while the daily figures are in DAILY. The gasoline demand figures are in OILWKLY.

| Weekly Prices | 05/24/10 | 05/17/10 | 05/10/10 | y/y | 2009 | 2008 | 2007 |
|---|---|---|---|---|---|---|---|
| Retail Regular Gasoline ($ per Gallon, Regular) | 2.79 | 2.86 | 2.91 | 14.4% | 2.35 | 3.25 | 2.80 |
| Light Sweet Crude Oil, WTI ($ per bbl.) | 69.02 | 74.97 | 80.22 | 14.1% | 61.39 | 100.16 | 72.25 |
| Natural Gas Price ($/mmbtu) | 4.25 | 4.20 | 3.96 | 12.9% | 3.95 | 8.88 | 6.97 |
by Tom Moeller May 25, 2010
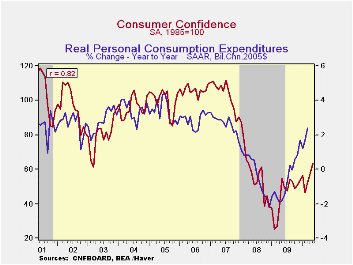
The Conference Board indicated that consumer confidence was unshaken in early May by U.S. stock market declines nor by European market turmoil. Their consumer confidence index rose 9.7% m/m to 63.3, its highest level since March 2008. The gain outpaced the Consensus expectation for a rise to 59.0. During the last ten years there has been an 82% correlation between the level of consumer confidence and the y/y change in real consumer spending. The Conference Board data can be found in Haver's CBDB database.
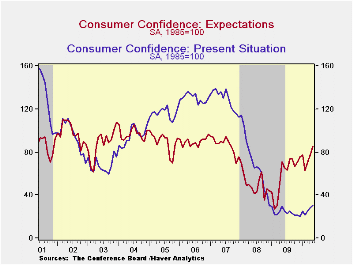
The expectations component of confidence improved the most m/m to its highest level since August 2007. Improved expectations for business conditions led the gain while expectations for employment and income rose to lesser extents. Consumers expect the inflation rate in twelve months to be 5.3% as they did last month and that remained down from last year's high of 7.7%. Interest rates in twelve months were expected to be higher by a lesser 54.1% of respondents but a slightly increased 12.5% expected rates to fall. A lessened 31.7% of respondents expected stock prices to rise.
Consumers' assessment of the present situation increased 7.1% m/m and May was improved by one-half from December's low. Jobs were seen as hard to get by a reduced 43.6% of respondents but jobs were seen as plentiful by only 4.6%. That was up just slightly from the series' historic low reached in November. Also improved was the percentage of respondents who saw business conditions as good. The percentage of consumers who thought business conditions were bad fell to 39.3%, off more-than ten points from its peak during the recession.
A reduced 1.9% of those surveyed plan to buy a home during the next six months. Also down slightly m/m to 26.2% were those who plan to buy a major appliance, versus 30.9% who planned to buy one back in 2007. An improved 6.0% plan to buy an automobile versus 6.0% in 2007 and a greater 2.8% plan to buy a new one, just off the series' historic low.
The Shape of Things to Come from the Federal Reserve Bank of San Francisco can be found here.

| Conference Board (SA, 1985=100) | May | April | March | y/y % | 2009 | 2008 | 2007 |
|---|---|---|---|---|---|---|---|
| Consumer Confidence Index | 63.3 | 57.7 | 52.3 | 15.5 | 45.2 | 57.9 | 103.4 |
| Present Situation | 30.2 | 28.2 | 25.2 | 1.7 | 24.0 | 69.9 | 128.8 |
| Expectations | 85.3 | 77.4 | 70.4 | 19.3 | 59.3 | 50.0 | 86.4 |
by Robert Brusca May 25, 2010

EMU order surged in March climbing at a 5.2% month to month after rising by 1.9% M-o-M in February. The three months growth rate is at 24.5% up from 17.3% over six months and 19.2% over 12-months. Orders strength is being lead by ‘foreign orders’ as that series is up a 33% annualized rate over three months compared to a 9.5% pace for domestic orders. But IN March domestic orders pulled ahead rising by 9.4% in the month compared to again of 6.2% for foreign orders.
German and French orders were up very strongly in March as Italian orders rose but not as briskly. German orders are building to a hectic pace rising at a three-month pace of just under 60% at an annual rate while in France the three-month pace is -22%. Italian orders are off at a three month annualized rate of -8.7%.
Manufacturing in the zone is seeing all sorts of divergences across countries right now. It is curious that concerns about Europe are sweeping across the continent as some excellent economic activity statistics are being posted. As of March the evidence is that the Euro-economy was still building a head of steam although there are differences across EMU member countries to be sure. Once again we get evidence that as financial sector worries have mounted the euro-economy is being underpinned by an event stronger economic recovery than had been appreciated.
| Euro-Area-16 and UK Industrial Orders | |||||||||
|---|---|---|---|---|---|---|---|---|---|
| Saar except m/m | Mo/Mo | Mar-10 | Feb-10 | Mar-10 | Feb-10 | Mar-10 | Feb-10 | ||
| Euro-Area Overview | Mar 10 |
Feb 10 |
Jan 10 |
3Mo | 3Mo | 6mo | 6mo | 12mo | 12mo |
| Total Orders | 5.2% | 1.9% | -1.5% | 24.5% | 7.0% | 17.3% | 10.2% | 19.2% | 12.5% |
| E-16 Domestic MFG orders | 9.4% | 1.7% | -8.1% | 9.5% | -5.2% | 5.4% | 2.2% | 11.7% | 1.5% |
| E-16 Foreign MFG orders | 6.2% | 6.8% | -5.1% | 33.9% | 20.3% | 25.7% | 29.1% | 26.5% | 20.9% |
| Countries: | Mar 10 |
Feb 10 |
Jan 10 |
3Mo | 3Mo | 6mo | 6mo | 12mo | 12mo |
| Germany (MFG): | 5.7% | 0.5% | 5.5% | 57.7% | 17.5% | 23.4% | 16.1% | 27.0% | 24.7% |
| France(Ind): | 6.5% | -1.0% | -10.9% | -22.4% | 12.5% | 2.2% | 3.1% | 10.6% | -5.6% |
| Italy (Ind): | 1.0% | -0.4% | -2.8% | -8.7% | 6.2% | 12.7% | 25.2% | 9.1% | 5.5% |
by Louise Curley May 25, 2010
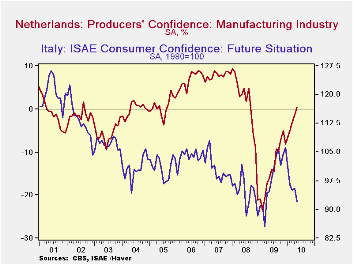
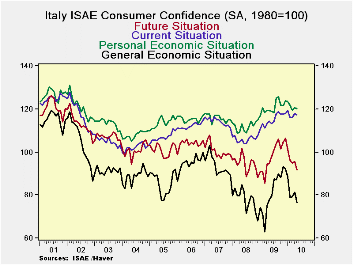
Just how the European consumers and producers are reacting to the on going financial problems of the Euro Area can be inferred, to some degree, from measures of confidence. Two of these were published today--Consumer Confidence in Italy and Producer Confidence in the Netherlands.
In Italy, the ISAE (Instituto di Studi e Analisi Economica) index (1980=100) of consumer confidence fell in May to 105.4 from 107.9 in April. The index is now down 7.2% from the recent peak of 113.6 in December, 2009. The overall indicator is based on the consumers' appraisals of the general economic situation, one's personal economic situation, the current situation and the future situation. Clearly confidence of the Italian consumers has been shaken by current events. The index for the general economic situation was reduced by 5.8% in May and the index for the future situation by 3.8%. The appraisal of the future situation is now close to the all time low reached in December 2008. The indexes for one's personal economic situation and the current situation were reduced by only 0.3% and 0.5% respectively. The four underlying appraisals are shown in the first chart.
In contrast to the Italian consumer, the Dutch producer has become less pessimistic in May than he was in April as can be seen in the second chart. The measure of producer confidence published by the Central Bureau of Statistics in the Netherlands is in the form of a percent balance between optimists and pessimists. Producer confidence in the Netherlands has not been strong. Ever since August 2008, the pessimists have outweighed the optimists. A peak excess of pessimists, 23.5%, was reached in February, 2009. Since then there has been a fairly steady decline in the pessimists but it was only in May of this year that there was an excess, though a small one, 0.4%, of optimists over pessimists. One factor that may account for some of the difference in the reactions of consumers and producers to the current financial turmoil is the declinein the euro. A lower euro is good for exports and hence for producers, while a lower euro makes imports more expensive and hence is bad for consumers.
| May 10 | Apr 10 | Mar 10 | Feb 10 | Jan 10 | Dec 09 | Nov 09 | Oct 09 | |
|---|---|---|---|---|---|---|---|---|
| Italy: Consumer Confidence (1980=100) | 105.4 | 107.9 | 106.3 | 107.6 | 111.6 | 113.6 | 112.7 | 111.7 |
| Neth: Producer Confidence (% Balance) | 0.4 | -1.4 | -3.5 | -5.0 | -6.5 | -8.1 | -5.0 | -7.2 |

Tom Moeller
AuthorMore in Author Profile »Prior to joining Haver Analytics in 2000, Mr. Moeller worked as the Economist at Chancellor Capital Management from 1985 to 1999. There, he developed comprehensive economic forecasts and interpreted economic data for equity and fixed income portfolio managers. Also at Chancellor, Mr. Moeller worked as an equity analyst and was responsible for researching and rating companies in the economically sensitive automobile and housing industries for investment in Chancellor’s equity portfolio. Prior to joining Chancellor, Mr. Moeller was an Economist at Citibank from 1979 to 1984. He also analyzed pricing behavior in the metals industry for the Council on Wage and Price Stability in Washington, D.C. In 1999, Mr. Moeller received the award for most accurate forecast from the Forecasters' Club of New York. From 1990 to 1992 he was President of the New York Association for Business Economists. Mr. Moeller earned an M.B.A. in Finance from Fordham University, where he graduated in 1987. He holds a Bachelor of Arts in Economics from George Washington University.
More Economy in Brief


