 Global| Apr 28 2009
Case-Shiller Home Price IndexFalls Further
by:Tom Moeller
|in:Economy in Brief
Summary
The S&P/Case-Shiller 20 Home Price Composite Index fell 1.9% during February and the decline lowered prices by 18.6% during the last twelve months and by 29.9% since their peak in May 2006. The series dates back only to 2000 and the [...]
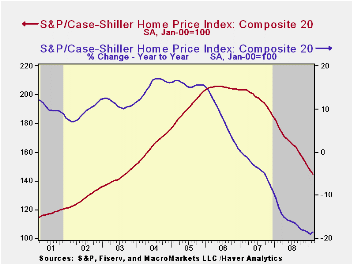
The S&P/Case-Shiller 20 Home Price Composite Index fell 1.9% during February and the decline lowered prices by 18.6% during the last twelve months and by 29.9% since their peak in May 2006. The series dates back only to 2000 and the February decline in prices was as expected.
The S&P/Case-Shiller home price series can be found in Haver's USECON database but the city data is in the REGIONAL database.
The Case-Shiller index of 20 U.S. cities and their surrounding areas is weighted to reflect price changes due to extensive remodeling, home additions or extreme neglect. For example, smaller weights are assigned to sales of homes that have undergone extensive remodeling.
The Case-Shiller composite index of homes in 10 metropolitan
areas, which has a longer history and dates back to 1987, also fell
1.9% and was down 18.8% year-to-year. The measure was down 31.0% since
the 2006 peak.
Weakest Regions: Home prices in Phoenix, Nevada were quite weak and fell 35.2% y/y and in San Francisco prices fell 31.0% y/y, off 44.0% from their early-2006 peak. Home prices in Las Vegas, Nevada fell 31.7% y/y and were down 48.0% from their peak. Prices in Miami fell 29.5% y/y while home prices in Los Angeles were down 24.0% y/y. In Tampa they fell 23.0% and in Detroit home prices dropped by 23.5% y/y, off 40.9% from the peak.
Less Weak Regions: In the Northeast, the decline in home prices continued less severe. Prices in New York fell 10.2% y/y, off 17.4% from their 2006 peak. Prices were down 7.2% year-to-year in Boston but in Chicago home prices were down a larger 17.6% y/y, 24.5% from the 2007 peak. In Cleveland, Ohio the decline in home prices accelerated during February and they fell 4.1% m/m and 8.4% y/y but in Dallas prices were off by a modest 4.5% y/y and by 8.8% from the 2007 peak. In Charlotte, North Carolina prices fell a moderate 9.3% y/y and in Denver home prices prices fell just 5.6% y/y.
The latest press release from Standard & Poor's can be found here. An overview of the S&P/Case-Shiller home price series can be found here.
The Case-Shiller data is available in Haver's USECON database.
Can Monetary Policy Affect GDP Growth? from the Federal Reserve Bank of St. Louis can be found here.
| S&P/Case-Shiller Home Price Index (SA, Jan 00 = 100) | February | January | Y/Y | 2008 | 2007 | 2006 |
|---|---|---|---|---|---|---|
| 20 City Composite Index | 144.56 | 147.36 | -18.6% | -15.8% | -3.8% | 7.6% |
by Tom Moeller April 28, 2009
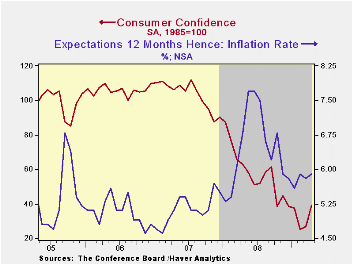 Consumers seem to be getting into a better mood which may
translate into more spending. The April index of consumer confidence,
reported by the Conference Board, improved sharply. Rising to its
highest level since November, the reading of 39.2 was up by more than
half from the February low. Lest there's too much excitement, however,
the level of confidence remained down by more than half from 2007
average. The latest figure was quite a bit firmer than Consensus
expectations for a reading of 29.0.
Consumers seem to be getting into a better mood which may
translate into more spending. The April index of consumer confidence,
reported by the Conference Board, improved sharply. Rising to its
highest level since November, the reading of 39.2 was up by more than
half from the February low. Lest there's too much excitement, however,
the level of confidence remained down by more than half from 2007
average. The latest figure was quite a bit firmer than Consensus
expectations for a reading of 29.0.
The Conference Board data can be found in Haver's CBDB database.
During the last ten years there has been an 86% correlation between the level of consumer confidence and the y/y change in real consumer spending.
Consumers' improved expectations drove the rise in confidence
this month with a 63.9% rise from the March level. The percentage of
respondents expecting business conditions to improve rose sharply to
15.6%, the highest level since 2007, but a reduced 25.3% still expected
them to worsen. That improvement was expected by 13.9% of respondents
to generate more jobs, double the recent low.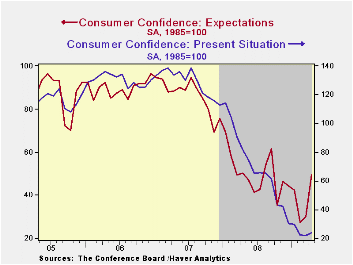
The present conditions index rose just modestly and remained near its recent low. It remained off by more than three-quarters from a year earlier. Jobs were seen as hard to get by 47.9% of respondents, near the highest since 1992, and jobs were seen as plentiful by only 4.5%. Business conditions were seen as good by just 7.6% and that was near the 1991 low. Those who thought conditions were bad fell slightly to 45.7%, still near the highest since 1983.
Expectations for the inflation rate in twelve months have been roughly stable since November at 5.9%. That's down from last year's high of 7.7%. Expectations about interest rates has started to increase with 38.8% of respondents expecting higher rates while 23.5% expect rates to fall. A greatly lessened 36.4% of respondents expected lower stock prices.
Are Fiscal Stimulus Funds Going to the "Right" States? from the Federal Reserve Bank of San Francisco is available here.
| Conference Board (SA, 1985=100) | April | March | Y/Y % | 2008 | 2007 | 2006 |
|---|---|---|---|---|---|---|
| Consumer Confidence Index | 39.2 | 26.9 | -37.6 | 57.9 | 103.4 | 105.9 |
| Present Situation | 23.7 | 21.9 | -71.1 | 69.9 | 128.8 | 130.2 |
| Expectations | 49.5 | 30.2 | -1.0 | 50.0 | 86.4 | 89.7 |
by Tom Moeller April 28, 2009

Regular gasoline prices last week averaged $2.05 per gallon, steady with the level reached in late March and up 41 cents from the December low. The figures are reported by the U.S. Department of Energy and can be found in Haver's WEEKLY database.
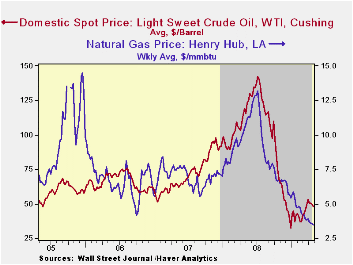
Crude oil prices, however, slipped again due to soft economic news. The price for a barrel of West Texas Intermediate fell to $47.83 last week, down from the late-March high of $53.09. Prices remained up, however, from the December low of $32.37 per barrel. Prices reached a high of $145.66 last July. The figures on crude oil production and inventories are available in Haver's Weekly Oil Statistics database.
In what has been a steady rate of decline, gasoline demand last week fell 2.5% y/y versus the 4.8% rate of decline seen last October. Less driving has been the result of higher gasoline prices and economic weakness. The change in demand is measured using the latest four weeks versus the same four weeks in 2008. Demand for all petroleum products was down 6.5% y/y led by a 40.1% drop in demand for residual fuel oil. These numbers are available in Haver's OILWKLY database.
The price of natural gas fell even further with the end to of winter heating season. Prices fell to $3.45 per mmbtu (-67.1% y/y) which was near the lowest level since 2002. The latest average price was down more than two-thirds from the high reached in early-July of $13.19/mmbtu.
Fed Confronts Financial Crisis by Expanding Its Role as Lender of Last Resort from the Federal Reserve Bank of Dallas is available here.
| Weekly Prices | 04/27/09 | 04/20/09 | Y/Y | 2008 | 2007 | 2006 |
|---|---|---|---|---|---|---|
| Retail Regular Gasoline ($ per Gallon, Regular) | 2.05 | 2.06 | -43.1% | 3.25 | 2.80 | 2.57 |
| Light Sweet Crude Oil, WTI ($ per bbl.) | 47.83 | 49.80 | -59.9% | 100.16 | 72.25 | 66.12 |
by Tom Moeller April 28, 2009
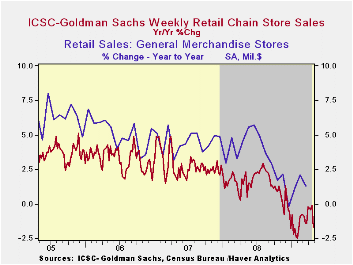
Consumer spending firmed this month. Though chain store sales slipped 0.7% last week, the International Council of Shopping Centers-Goldman Sachs Index indicated that on average April sales so far rose 1.4% from the March average following that month's tepid 0.3% uptick. The year-to-year change in the indicator remained, however, negative.
During the last ten years there has been a 64% correlation between the year-to-year growth in chain store sales and the growth in general merchandise sales. These weekly figures are available in Haver's SURVEYW database.
The ICSC-Goldman Sachs retail chain-store sales index is constructed using the same-store sales (stores open for one year) reported by 78 stores of seven retailers: Dayton Hudson, Federated, Kmart, May, J.C. Penney, Sears and Wal-Mart.
The outlook for sales continued cautiously optimistic. The leading indicator of sales has been moving sideways since early February.
Too big to fail from the Federal Reserve Bank of Minneapolis can be found here.
| ICSC-UBS (SA, 1977=100) | 04/24/09 | 04/17/09 | Y/Y | 2008 | 2007 | 2006 |
|---|---|---|---|---|---|---|
| Total Weekly Chain Store Sales | 488.0 | 491.3 | -1.7% | 1.4% | 2.8% | 3.3% |
by Louise Curley April 28, 2009
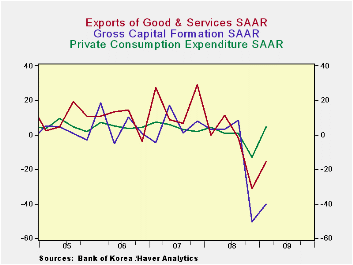
Although South Korea's real Gross Domestic Product improved slightly in the first quarter of this year, the economy is still in recession. GDP rose 0.21% at a seasonally adjusted annual rate (saar) in the first quarter of 2009, but it is 18.6%%, saars, below the third quarter of 2008. The fourth quarter of last year saw precipitous declines in practically every sector of the economy--the exception being an increase in Government Consumption expenditures.The table below shows the saars for the major components of GDP and the attached chart shows the saars for private consumption, gross capital formation and exports of goods and services. Gross capital formation suffered the biggest decline, 50.14% saar in the fourth quarter of 2008. Inventories were cut by 914 billion chained 2005 Won while expenditures on equipment declined at a saar of 45.80%. The decline in construction was a saar of 11.42%. Exports of goods and services declined by 32.2% while imports of goods and services declined at a saar of 45.8%
Government stimulus programs resulting in increased government consumption expenditures and construction spending were largely responsible for the increase in activity that took place in the first quarter. Private consumption improved slightly but private business spending on equipment continued to decline and there was a major liquidation of inventories amounting to 8.5 trillion chained 2005 won. The declines in exports and imports moderated in the first quarter but were still significant.
|
Seasonally adjusted annual rates of return ex where noted |
Q1 09 | Q4 08 | Q3 08 | Q2 08 | Q1 08 | 2008 | 2007 | 2006 |
|---|---|---|---|---|---|---|---|---|
| Gross Domestic Product | 0.21 | -18.78 | 0.97 | 1.72 | 4.38 | 2.22 | 5.11 | 5.16 |
| Private Consumption | 1.79 | -17.29 | -0.05 | -0.65 | 4.29 | 0.92 | 4.06 | 4.73 |
| Government Consumption | 15.23 | 4.11 | 4.30 | 4.83 | 4.97 | 4.21 | 5.39 | 6.58 |
| Gross Capital Formation | -40.34 | -50.14 | 8.34 | 3.04 | 3.16 | 0.80 | 3.55 | 4.42 |
| Construction | 23.06 | -11.42 | 0.23 | -1.23 | -9.73 | -2.10 | 1.44 | 0.53 |
| Equipment | -33.11 | -45.80 | 0.68 | 1.55 | -1.40 | -1.99 | 9.29 | 8.19 |
| Inventory Change (Bil. chained 2005 Won) | -8522 | -914 | 6376 | 4979 | 4512 | 14958 | 7210 | 10017 |
| Exports of Goods&Services | -15.64 | -31.20 | -1.62 | -11.34 | -0.11 | 5.73 | 12.61 | 11.37 |
| Imports of Goods&Services | -30.38 | -45.83 | 4.29 | 12.31 | -3.01 | 3.66 | 11.68 | 11.29 |
by Louise Curley April 28, 2009

There was some good news for the U.K. in the latest Confederation of Business Industries (CBI) Survey of the Distributive Trades. More respondents reported increases in retail sales over a year ago than those reporting decreases. Although the balance was small--3%--it was the first positive result since the 1% balance in March 2008 and represented a dramatic reversal from the large negative balances of 25%-55% recorded in the last four months. It was, moreover, unexpected. The same respondents had expected April to show a negative balance of 47% and they still expect a negative balance of 15% for May. The first chart shows the reported and expected percent balances for retail trade.
While still reporting negative balances for wholesale
business, the balance for April was -18% well below the negatives
balances recorded earlier in the year and below the -56% expected for
April. Wholesalers, however, continue pessimistic and are expecting
decreases in sales relative to a year ago will exceed increases by 23%
in May. The second chart shows the reported and expected percent
balances for wholesale trade.
Reported sales in the motor trades showed a negative balance of 16%, compared with a negative balance of only 6% in March. The reported figures have, in recent months, been much better than the expected results. A negative balance of 48% was expected for April versus the -16% that was reported. A negative balance of 62% is expected for May. The third chart shows the reported and expected percent balances for the motor trade.
| Percent Balance | May 09 | Apr 09 | Mar 08 | Feb 09 | Jan 09 | Dec 08 |
|---|---|---|---|---|---|---|
| Retail Reported | -- | 3 | -44 | -25 | -47 | -55 |
| Expected | -15 | -47 | -33 | -52 | -49 | -40 |
| Wholesale Reported | -- | -18 | -65 | -47 | -91 | -25 |
| Expected | -23 | -56 | -46 | -37 | -30 | -57 |
| Motor Trades Reported | -- | -16 | -6 | -50 | -68 | -100 |
| Expected | -62 | -48 | -59 | -57 | -87 | -98 |
by Robert Brusca April 28, 2009
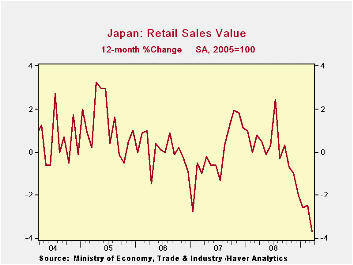
The Year-over-year the drop in Japan’s retail sales is
worsening. But overall seasonally adjusted sales while down by a sharp
1.1% m/m in March are not accelerating their drop over three months
compared to six months. The 5.6% annual rate of decline over three
months is less than the 7.6% pace of decline over six months but still
much greater than the 3.7% pace of decline over 12-months. There is not
much good news in those trends. In the just-completed quarter, sales
are still falling at a rapid 7% annual rate compared to Q4. With Japan
poised for its traditional Golden Week holiday, consumer spending is
again set to be tested. While the US and Europe have showed some
sporadic signs of improvement in data trends, there has been little in
the way of constructive data from Japan as of yet.
| Japan Retail Sales Trends | ||||||||
|---|---|---|---|---|---|---|---|---|
| Mar-09 | Feb-09 | Jan-09 | 3-mo | 6-mo | 12-mo | Yr-Ago | Q-to-Date | |
| Total SA | -1.1% | -0.2% | -0.1% | -5.6% | -7.6% | -3.7% | 3.2% | -7.0% |
| Not seasonally adjusted | ||||||||
| Total: Nominal | -0.4% | -1.2% | 0.9% | -3.1% | -6.6% | -3.9% | 4.2% | -6.7% |
| Motor Vehicles | -2.0% | -6.1% | 3.7% | -17.0% | -10.9% | -6.3% | 10.0% | -1.4% |
| Food& Beverage | 0.7% | -1.5% | -0.5% | -5.1% | -0.6% | 0.4% | 2.1% | -7.8% |
| Fabric apparel & access | -0.9% | 0.0% | 1.7% | 2.9% | -5.7% | -5.6% | -1.3% | -6.1% |
| Rest of Retail | -0.7% | -0.1% | 1.0% | 0.7% | -9.3% | -5.6% | 5.0% | -7.2% |

Tom Moeller
AuthorMore in Author Profile »Prior to joining Haver Analytics in 2000, Mr. Moeller worked as the Economist at Chancellor Capital Management from 1985 to 1999. There, he developed comprehensive economic forecasts and interpreted economic data for equity and fixed income portfolio managers. Also at Chancellor, Mr. Moeller worked as an equity analyst and was responsible for researching and rating companies in the economically sensitive automobile and housing industries for investment in Chancellor’s equity portfolio. Prior to joining Chancellor, Mr. Moeller was an Economist at Citibank from 1979 to 1984. He also analyzed pricing behavior in the metals industry for the Council on Wage and Price Stability in Washington, D.C. In 1999, Mr. Moeller received the award for most accurate forecast from the Forecasters' Club of New York. From 1990 to 1992 he was President of the New York Association for Business Economists. Mr. Moeller earned an M.B.A. in Finance from Fordham University, where he graduated in 1987. He holds a Bachelor of Arts in Economics from George Washington University.
More Economy in Brief


