 Global| Oct 27 2009
Case-Shiller Home Price Index Increases For Third Consecutive Month
by:Tom Moeller
|in:Economy in Brief
Summary
Home prices have firmed along with the improvement seen in home sales. The August S&P/Case-Shiller Home Price Composite Index of twenty metro-markets rose 1.0% from July following like gains during the prior two months. The monthly [...]
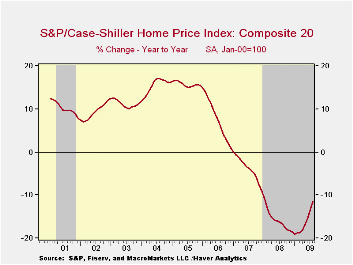 Home prices have firmed along with the improvement seen in
home sales. The August S&P/Case-Shiller
Home Price Composite Index of twenty metro-markets rose 1.0% from July
following like gains during the prior two months. The monthly increase
lowered the y/y drop to 11.4% which was
less-than-expected by Consensus. Nevertheless, prices were down by
nearly one-third since the peak in May 2006. Not seasonally adjusted
prices were even stronger m/m and posted a 1.2% increase after a 1.6%
gain during July.
Home prices have firmed along with the improvement seen in
home sales. The August S&P/Case-Shiller
Home Price Composite Index of twenty metro-markets rose 1.0% from July
following like gains during the prior two months. The monthly increase
lowered the y/y drop to 11.4% which was
less-than-expected by Consensus. Nevertheless, prices were down by
nearly one-third since the peak in May 2006. Not seasonally adjusted
prices were even stronger m/m and posted a 1.2% increase after a 1.6%
gain during July.
The Case-Shiller composite index of home prices in 10
metropolitan areas, which has a longer history and dates back to 1987,
also firmed last month by 1.0% (-10.7% y/y). This measure also was down
by nearly one-third since the 2006 peak.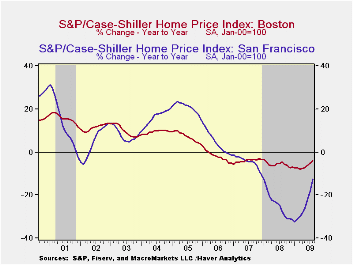
The Case-Shiller index of 20 U.S. cities and their surrounding areas is value-weighted. A greater index weight is assigned to more expensive homes and the series dates back only to 2001. The S&P/Case-Shiller home price series can be found in Haver's USECON database and the city data highlighted below is in the REGIONAL database. The latest press release is available here . An overview of the S&P/Case-Shiller home price series can be found here.
Less Weak Regions:Home prices in some areas
of the country have firmed lately though they remain down year-to-year.
Prices in Denver rose for their sixth month (-2.0% y/y) while
in Dallas prices rose for the fifth consecutive month. That pared the
y/y change to -1.3% from its worst of -5.5% this past March. Boston
prices also were higher during August (-4.2% y/y) while in Chicago home
prices were quite strong m/m, rising 1.2%, but they still were off
12.7% y/y. In the New York region prices ticked up 0.3% m/m (-9.6% y/y)
while in Charlotte, North Carolina prices slipped 0.4% (-8.6% y/y). In
Cleveland, Ohio, though prices fell 1.0% m/m during August, the y/y
decline amounted to just 2.9%. In the Washington, D.C. metro area
prices rose for the fourth straight month. The 1.2% increase left them
off 7.9% y/y.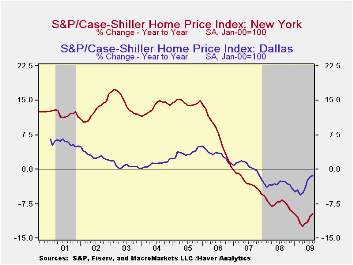
Weakest Regions: Several other areas of the country have shown limited improvement. Though home prices in Phoenix, Arizona rose for the third consecutive month they remained off 25.2% y/y. Home prices in Las Vegas, Nevada continued their rapid rate of decline with a 0.8% m/m drop (-29.9% y/y) and were down by roughly one-half from their peak. Home prices in Miami also rose for the third straight month but were off 18.9% y/y while home prices in Los Angeles also firmed m/m (-12.0% y/y). In Tampa, Florida prices also rose for the third month but remained off 17.7% y/y. In Detroit prices rose for the first time since early 2006 (-22.7% y/y) yet prices were off by nearly one-half from the peak.In San Francisco prices firmed for the fourth straight month and that eased the y/y decline to 12.6%.
The monthly S&P Case Shiller Home Price data can be found in Haver's USECON database and the regional data is available in the REGIONAL database.
| S&P/Case-Shiller Home Price Index (SA, Jan 00 = 100) | August m/m | July m/m | Y/Y | 2008 | 2007 | 2006 |
|---|---|---|---|---|---|---|
| 20 City Composite Index | 1.0% | 1.2% | -11.4% | -15.8% | -3.8% | 7.6% |
| Regional Indicators | ||||||
| Atlanta | 0.5 | 1.6 | -10.6 | -8.5 | 0.7 | 4.3 |
| Boston | 1.0 | 0.6 | -4.2 | -5.7 | -4.0 | -1.8 |
| Chicago | 1.2 | 2.1 | -12.7 | -10.0 | -1.0 | 6.6 |
| Dallas | 0.0 | 0.8 | -1.3 | -3.3 | 0.5 | 3.2 |
| Denver | 1.0 | 0.7 | -2.0 | -4.9 | -1.7 | 2.1 |
| Los Angeles | 1.3 | 1.2 | -12.0 | -24.2 | -5.2 | 11.6 |
| New York | 0.3 | 0.9 | -9.6 | -7.4 | -2.8 | 7.5 |
| San Francisco | 2.6 | 2.8 | -12.6 | -24.3 | -4.5 | 4.5 |
by Robert Brusca October 27, 2009
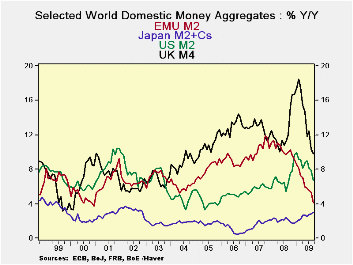
Over view: Money supply growth in the key economies continues
to erode on a broad front. Japan sports a contrary pattern with
steadily increasing growth in money supply. The UK has been through the
biggest boom/bust in money supply growth; the economy is still
languishing in recession. Money growth in the US and in the e-Zone is
slowing as well.
Credit growth in EMU has turned negative. Loan growth is
declining even over 12-months. In real terms, credit to residents is
also falling. Over three-months inflation-adjusted loan volume in the
Zone is falling; over six months it’s flat.
Real money supplies are declining over six months in the US
and in the UK. In EMU real money balances are growing at a low 2% pace.
Japan’s inflation-adjusted money supply is accelerating or stabilizing.
While it is clear that different regions have different
nominal and real money growth characteristics, only Japan is showing a
steady move back to monetary stimulus. At that it still has the lowest
Yr/Yr nominal money growth in the group. The UK has the biggest drop
off in nominal money growth but still had the strongest Yr/Yr rate of
growth. The US and EMU growth rates are closer together with EMU the
peak coming earlier than in the US.
The more disturbing news is the lack of credit growth. In EMU it is contracting. Banks have been stabilized by various policy actions, but those actions did not translate directly into help for the nonbank sector as banks have been very careful with new lending. In the US the President is now trying to jawbone to stimulate small business lending. Without credit growth, money growth will not be fully activated. In the US small business is the main source of job growth which is greatly needed to produce a real recovery. In Germany Chancellor Merkel is warning of another crisis in 2011 and more unemployment. There remains a lot of work to be done to get areal recovery going.
| Look at Global and Euro Liquidity Trends | |||||||
|---|---|---|---|---|---|---|---|
| Saar-all | Euro Measures (E13): Money & Credit | G-10 Major Markets: Money | Memo | ||||
| €€-Supply M2 | Credit: Residential |
Loans | $US M2 | ££UK M4 | ¥ ¥Jpn M2+Cds | OIL:WTI | |
| 3-MO | 2.8% | 0.3% | -1.6% | -1.9% | 8.7% | 3.2% | -0.4% |
| 6-MO | 2.8% | 0.8% | -0.9% | 0.2% | 1.7% | 3.3% | 112.9% |
| 12-MO | 4.1% | 2.1% | -0.3% | 6.7% | 9.8% | 3.0% | -32.7% |
| 2Yr | 7.0% | 6.3% | 4.2% | 6.5% | 10.9% | 2.6% | -6.2% |
| 3Yr | 8.1% | 7.9% | 6.3% | 6.5% | 11.6% | 2.3% | 2.8% |
| Real Balances: deflated by Own CPI. Oil deflated by US CPI | |||||||
| 3-MO | 2.0% | -0.4% | -2.3% | -4.3% | 5.3% | 4.0% | -2.8% |
| 6-MO | 2.0% | 0.0% | -1.7% | -2.6% | -1.0% | 5.2% | 106.9% |
| 12-MO | 4.5% | 2.5% | 0.1% | 8.1% | 8.6% | 5.2% | -31.8% |
| 2Yr | 5.3% | 4.6% | 2.5% | 4.7% | 7.5% | 2.6% | -7.8% |
| 3Yr | 6.2% | 6.0% | 4.4% | 4.3% | 8.7% | 2.4% | 0.7% |
| Japan CPI for Aug is an estimate; it uses the July value to produce the real balance figure | |||||||
by Tom Moeller October 27, 2009
 Earlier gains in consumer confidence have flagged with the
continued run-up in unemployment. The Conference Board indicated that
consumer confidence during October fell 10.7% from September. The
decline was the fourth in the last five months though confidence
remained nearly double this Winter's low. The Conference Board data can
be found in Haver's CBDB database.
Earlier gains in consumer confidence have flagged with the
continued run-up in unemployment. The Conference Board indicated that
consumer confidence during October fell 10.7% from September. The
decline was the fourth in the last five months though confidence
remained nearly double this Winter's low. The Conference Board data can
be found in Haver's CBDB database.
During the last ten years there has been an 86% correlation between the level of consumer confidence and the y/y change in real consumer spending.
Consumers' assessment of the current economic conditions fell
again this month and remained near the historic low. It remained off by
almost two-thirds from one year earlier. Jobs were seen as hard to get
by an increased 49.6% of respondents and jobs were seen as plentiful by
3.4% which was near the series' historic low. Business conditions were
seen as good by just 7.7% and that also was near the series' low.
Consumers who thought business conditions were bad rose slightly to
47.1%. While off somewhat from its high the reading still near the
highest since 1983.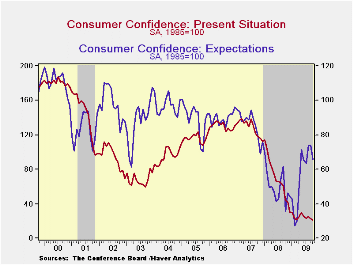
The expectations component of confidence fell hard from September but the index remained near the highest level since late-2007. The percentage of respondents expecting business conditions to improve slipped to 20.8% though that remained near the highest level since 2004. Though down slightly m/m, an improved 16.3% of respondents expected economic improvement to generate more jobs, more than double the percentage at the recent low. However, that gain was not expected to generate much more income.
Expectations for the inflation rate in twelve months held stable at 5.3%, the lowest level since 2007 and down from last year's high of 7.7%. Interest rates in twelve months were expected to be higher by 49.5% of respondents, while 15.8% expected rates to fall. A greatly increased 32.7% of respondents expected stock prices to rise.
Consumers continued to manage their spending plans cautiously. Just 2.3% plan to buy a home during the next six months while just 23.3% plan to buy a major appliance. That's versus 30.9% back in 2007. Only 4.4% plan to buy an automobile versus 6.0% in 2007. Just 1.4% plan to buy a new one.
| Conference Board (SA, 1985=100) | October | September | Y/Y % | 2008 | 2007 | 2006 |
|---|---|---|---|---|---|---|
| Consumer Confidence Index | 47.7 | 53.4 | 22.9 | 57.9 | 103.4 | 105.9 |
| Present Situation | 20.7 | 23.0 | -52.4 | 69.9 | 128.8 | 130.2 |
| Expectations | 65.7 | 73.7 | 84.0 | 50.0 | 86.4 | 89.7 |
by Tom Moeller October 27, 2009

Gasoline prices rose to nearly their highest level in one year. The pump price for regular gasoline increased last week to $2.67 per gallon which was roughly the highest level since October of last year. Moreover, prices remain up from the December low of $1.61. This week prices rose even further and the wholesale gasoline price moved to $2.07 from an average $2.05 last week. The figures are reported by the U.S. Department of Energy and can be found in Haver's WEEKLY & DAILY databases.
Higher crude oil prices are behind the rise in gas prices and light sweet crude (WTI) rose to an average $80.35 per barrel last week, up from the December low of $32.37. Yesterday, the spot market price for light sweet crude oil leveled off and slipped to $78.68 per barrel.
Behind the increase in energy prices is an increase in the
demand for gasoline. Last week, it posted a 3.4% rise versus one year
ago. The gain was nearly the strongest since the fall of 2006. Demand
for residual fuel oil also increased 22.8% y/y while distillate demand
halved its recent decline to 11.5% y/y. 
Finally, an earlier abundance of gasoline has eased somewhat. Gasoline inventories were up 5.3% y/y last week which was one-quarter of the gain last month. The gain in crude oil inventories also halved to 8.9% y/y and inventories of residual fuel oil are down 8.5% versus last year.
Natural gas prices also strengthened last week, ahead of the winter heating season, to an average of $4.70 per mmbtu (-30.2% y/y). Though they remained down by two-thirds from the high reached in early-July of last year of $13.19/mmbtu, they are more than double the low reached early last month. Yesterday prices increased further to $4.55/mmbtu.
What is Driving Energy Prices from the Federal Reserve Bank of Dallas is available here.
| Weekly Prices | 10/26/09 | 10/19/09 | Y/Y | 2008 | 2007 | 2006 |
|---|---|---|---|---|---|---|
| Retail Regular Gasoline ($ per Gallon, Regular) | 2.67 | 2.57 | 0.7% | 3.25 | 2.80 | 2.57 |
| Light Sweet Crude Oil, WTI ($ per bbl.) | 80.35 | 75.74 | 17.8% | 100.16 | 72.25 | 66.12 |
by Louise Curley October 28, 2009

Entrepreneurs in France and the Netherlands continue to shed
some of their pessimism concerning economic prospects, but they are by
no means optimistic. From the low point in February, 2009, when
pessimists in the Netherlands outweighed the optimists by 22.9%,
pessimists still outweigh the optimists by 7.8%. In France, the
indicator of business confidence is so created that its long term
average is 100 with a standard deviation of 10. The low point at 68 in
March 2009 was more than three standard deviations below the long term
average. While the indicator has moved up to 86 in October, it is still
more than one standard deviation below average. The first chart shows
the measures of business confidence in the Netherlands and in France.
Consumers in France and in Italy had become disenchanted earlier than the business community. Confidence among consumers in both countries reached lows in July, 2008. Since then confidence among Italian consumers has improved sharply, if erratically. October was another decline in the upward but erratic path of Italian consumer confidence. The index fell to 111.7 (1980=100) from 113.6 in September. It is, however, almost 17% above the low point. The increase in confidence from the low point among French households has been less dramatic than that in Italy, as can be seen in the second chart. The excess of pessimists over optimists has declined from 47% to 35% in October, an improvement of 12 basis points. In spite of the rise in confidence, pessimism among consumers in France and Italy still outweighs optimism concerning the economic outlook.
| Oct 09 | Sep 09 | Aug 09 | Jul 08 | Low | Date | 2008 | 2007 | 2006 | |
|---|---|---|---|---|---|---|---|---|---|
| Business Confidence | |||||||||
| Netherlands (% Balance) | -7.8 | -9.8 | -9.3 | -14.8 | -22.9 | 2/09 | 0.4 | 7.8 | 6.8 |
| France(Synthetic Index: Avg =100, St Dev =10) | 86 | 83 | 79 | 76 | 68 | 3/09 | 96 | 110 | 107 |
| Consumer Confidence | |||||||||
| Italy (1980=100) | 111.7 | 113.6 | 111.8 | 107.5 | 95.8 | 7/08 | 100.6 | 108.5 | 108.7 |
| France (% Balance) | -35 | -36 | -37 | -38 | -47 | 7.08 | -42 | -21 | -25 |

Tom Moeller
AuthorMore in Author Profile »Prior to joining Haver Analytics in 2000, Mr. Moeller worked as the Economist at Chancellor Capital Management from 1985 to 1999. There, he developed comprehensive economic forecasts and interpreted economic data for equity and fixed income portfolio managers. Also at Chancellor, Mr. Moeller worked as an equity analyst and was responsible for researching and rating companies in the economically sensitive automobile and housing industries for investment in Chancellor’s equity portfolio. Prior to joining Chancellor, Mr. Moeller was an Economist at Citibank from 1979 to 1984. He also analyzed pricing behavior in the metals industry for the Council on Wage and Price Stability in Washington, D.C. In 1999, Mr. Moeller received the award for most accurate forecast from the Forecasters' Club of New York. From 1990 to 1992 he was President of the New York Association for Business Economists. Mr. Moeller earned an M.B.A. in Finance from Fordham University, where he graduated in 1987. He holds a Bachelor of Arts in Economics from George Washington University.
More Economy in Brief


