 Global| May 27 2008
Case-Shiller Home Price Index Declined Again
by:Tom Moeller
|in:Economy in Brief
Summary
The S&P/Case-Shiller Composite 20 home price index fell 2.2% m/m in March, continuing a decline of about that magnitude during each of the prior four months. This index of U.S. home prices has fallen in every month since its peak in [...]
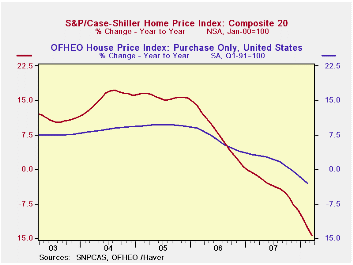
The S&P/Case-Shiller Composite 20 home price index fell 2.2% m/m in March, continuing a decline of about that magnitude during each of the prior four months. This index of U.S. home prices has fallen in every month since its peak in July of 2006 and the decline totals 16.6% during that period. The series dates back only to 2000.
For the first quarter overall, home prices fell 6.7% and that was the largest decline since the series peak in 2Q06. Year to year, 1Q prices were down 14.1%.
The Case-Shiller index of 20 U.S. cities and their surrounding
areas is not adjusted for the quality or the size of a home. The home
price index from the Office of Federal Housing Enterprise Oversight
(OFHEO), released last week, does make these adjustments. This series
indicates that during 1Q08 house prices were roughly unchanged y/y but
the purchase-only price index fell 3.1% y/y.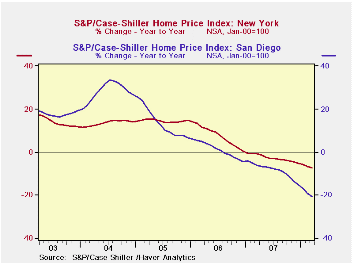
The Case-Shiller composite index of homes in 10 metropolitan areas has a longer history and dates back to 1987. This measure of prices fell 2.4% in March and was down 15.3% year-to-year.
Home prices in Las Vegas Nevada remained quite weak and were down 25.9% y/y. Prices in Miami were off 24.6% and home prices in Los Angeles were off 21.7%. In San Diego prices fell 20.5% but they were off a lesser 7.4% in New York and by 5.9% in Boston.
In Dallas prices also were off just moderately, 3.3% and they were up 0.8% in Charlotte, North Carolina.
| S&P/Case-Shiller Home Price Index (NSA, Jan 00 = 100) | March | February | Y/Y | 2007 | 2006 | 2005 |
|---|---|---|---|---|---|---|
| 20 City Composite Index | 172.16 | 176.00 | -14.4% | -3.8% | 7.6% | 15.8% |
by Tom Moeller May 27, 2008
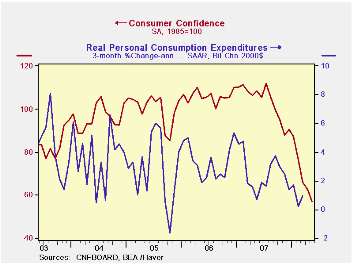
For May, the Conference Board reported that consumer confidence fell by 8.9% m/m which was roughly double the decline registered in April. The decline also doubled the consensus expectation for a 4.5% drop.
The May shortfall left confidence at its lowest level since late 1992.
The present conditions index led the May decline with a 9.2%
m/m drop to the lowest level since late 2003. By region the index is
off notably in the Pacific (-52.2% y/y), mid-Atlantic (-54.2% y/y), the
South Atlantic (-49.0% y/y), and in the New England (-43.7% y/y) states.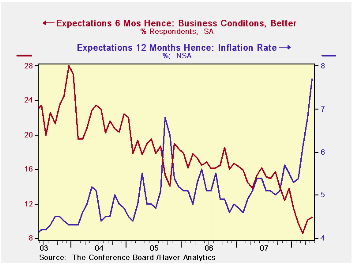
Just 13.1% of respondents saw business conditions as good, the lowest since early 1992. Jobs as plentiful were seen by a much lessened 16.3% while 28.0% saw jobs as hard to get, the highest since late 2004.
The expectations component of the index fell 8.6% to its lowest level since the mid-1970s. The percentage of respondents expecting business conditions to worsen in six months rose to 33.6% and the percentage looking for income to decline rose to 14.9%.
Expectations for the inflation rate again rose, last month to 7.7%. That was the highest level in the series' 20 year history.
Consumer Confidence Surveys: Can They Help Us Forecast Consumer Spending in Real Time? is a 2006 article from the Federal Reserve Bank of Philadelphia. It answers "no" and it is available here.
| Conference Board (SA, 1985=100) | May | April | Y/Y % | 2007 | 2006 | 2005 |
|---|---|---|---|---|---|---|
| Consumer Confidence Index | 57.2 | 62.8 | -47.3 | 103.4 | 105.9 | 100.3 |
| Present Situation | 74.4 | 81.9 | -45.3 | 128.8 | 130.2 | 116.1 |
| Expectations | 45.7 | 50.0 | -49.3 | 86.4 | 89.7 | 89.7 |
by Tom Moeller May 27, 2008
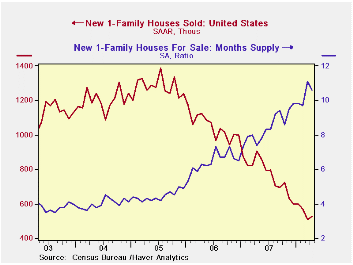
Sales new single family homes recovered 3.3% to 526,000, but the March decline of 11.0% was revised deeper from an initial indication of an 8.5% drop. Sales were down 62.1% from their July 2005 peak. An April sales level of 527,000 had been expected.
By region, sales increases during April were logged in each of
the countries' regions except in the South.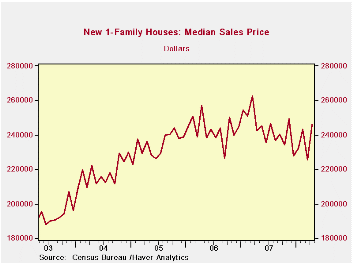
The median price for a new single family home fell 6.8% to
$227,600 and reduced prices to near their lowest since 2004.
The number of new homes for sale fell 2.4% but because of a larger decline in newly constructed homes, the y/y decline in home inventories is a greater 16.9% y/y. That inventory was down 20.3% from the peak in mid-2006. The decline in the number of unsold homes has been greatest in the West (-20.2% y/y).
The month's supply of new homes for sale ticked lower to 10.6 from its high of 11.1 in March.
| US New Homes | April | March | Y/Y | 2007 | 2006 | 2005 |
|---|---|---|---|---|---|---|
| Total Sales (SAAR, 000s) | 526 | 509 | -42.0% | 768 | 1,049 | 1,279 |
| Northeast | 34 | 24 | -58.0 | 64 | 64 | 81 |
| Midwest | 73 | 69 | -39.7 | 118 | 161 | 203 |
| South | 289 | 296 | -41.7 | 408 | 559 | 638 |
| West | 130 | 120 | -37.8 | 178 | 266 | 356 |
| Median Price (NSA, $) | 246,100 | 225,500 | 1.5% | 243,742 | 243,067 | 234,208 |
by Louise Curley May 27, 2008
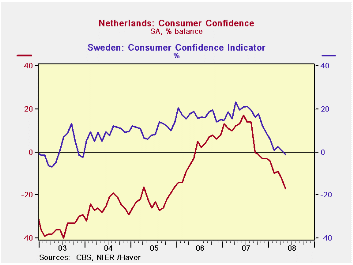
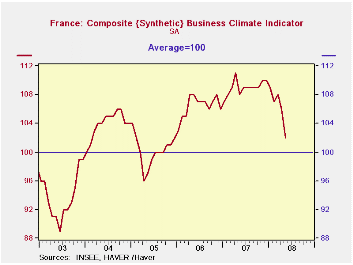
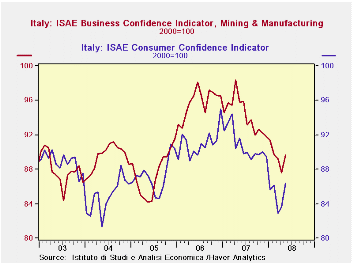
Confidence measures were released today for Italy, France, Sweden and the Netherlands. Most showed a continued loss of confidence both by consumers and business. Consumer confidence in the Netherlands and in Sweden are shown in the first chart. In France, business confidence fell 3.8% from its index value of 106 in April to 102 in May, as shown in the second chart. (France's measure of business confidence is a synthetic index, designed to average 100 with a standard deviation of 10).
Italy, however, surprised with slight reversals in the down trends in both consumer and business confidence in May as can be seen in the third chart. While consumer confidence in the Netherlands continued to fall, business confidence in the Netherlands improved. The excess of business optimists over pessimists rose from 3.0% to 3.7%. In spite of the improvements in consumer and business confidence in Italy and in business confidence in the Netherlands in May, all the indicators are well below the levels of a year ago.
| CONFIDENCE MEASURES | May 08 | Apr 08 | May 07 | M/M Chg | Y/Y Chg | 2007 | 2006 | 2005 |
|---|---|---|---|---|---|---|---|---|
| CONSUMER CONFIDENCE | ||||||||
| Netherlands (% balance) | -17 | -12 | 13 | -5 | -30 | 8 | -1 | -22 |
| Sweden (% balance) | -1.1 | 0.8 | 19.7 | -1.9 | -20.8 | 17.4 | 17.1 | 10.5 |
| Italy (2000=100) | 86.4 | 83.7 | 91.6 | 3.3% | -5.7% | 90.8 | 81.0 | 87.3 |
| BUSINESS CONFIDENCE | ||||||||
| France (Average=100, SD=10) |
102 | 106 | 108 | -3.8% | -5.5% | 109 | 106 | 100 |
| Italy (2000=100) | 89.6 | 87.6 | 95.8 | 2.3% | -6.5% | 94.3 | 95.8 | 87.5 |
| Netherlands(% balance) | 3.7 | 3.0 | 8.8 | 0.7 | -5.1 | 7.8 | 6.8 | 0.6 |
by Robert Brusca May 27, 2008
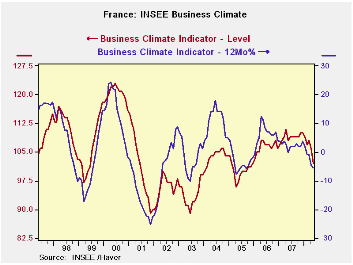
The INSEE survey of business sentiment is lower in May, as the overall index fell to 102 from 106 in April. The index (blue line) has been moving sideways until early this year. The four point drop is the sharpest since April of 2005. Still the climate index is above its average (since 1990) by one point. And still resides in the upper portion of its range, 58th percentile. The recent trends put it at a raw reading of -15, well below the average at -5, ensconced in the 42nd percentile of its range. The likely trend, however is extremely strong standing in the 84th percentile of its range. That one is surprising since other readings hardly seem to justify it. Overall orders and foreign orders are in about the 58th percentile of their respective ranges. Price expectations are high, in the 78th percentile of their range and well above average.
French president Sarkozy is asking the EMU to put a freeze on the VAT on fuel. Since the VAT is a percentage tax it boosts the price of fuel further each time overall oil/fuel prices rise on world markets. Fuel costs in EMU are already at extreme levels. France has been suffering though a wave of protests over high fuel costs. In the UK a protest was made along the M4 by freight haulers wanting a VAT rebate as essential users for the high fuel costs. Energy costs are clearly out of hand when we see this sort of thing.
For some reason haulers and other businesses do not think they are able to pass on high fuel costs to end users. While that may be good for the inflation fight it raised questions about growth prospects.
| INSEE Industry Survey | ||||||||||
|---|---|---|---|---|---|---|---|---|---|---|
| Since Jan 1990 | Since Jan 1990 | |||||||||
| May-08 | Apr-08 | Mar-08 | Feb-08 | %tile | Rank | Max | Min | Range | Mean | |
| Climate | 102 | 106 | 108 | 107 | 58.0 | 105 | 123 | 73 | 50 | 101 |
| Production | ||||||||||
| Recent Trend | -15 | -7 | -6 | -9 | 42.2 | 138 | 44 | -58 | 102 | -5 |
| Likely Trend | 48 | 48 | 52 | 43 | 84.4 | 5 | 63 | -33 | 96 | 9 |
| Orders/Demand | ||||||||||
| Orders & Demand | -11 | -5 | 1 | -1 | 58.6 | 90 | 25 | -62 | 87 | -14 |
| Fgn Orders & Demand | -7 | 3 | 1 | 1 | 57.3 | 94 | 31 | -58 | 89 | -10 |
| Prices | ||||||||||
| Likely Sales Price Trend | 14 | 14 | 12 | 16 | 78.7 | 20 | 24 | -23 | 47 | 1 |

Tom Moeller
AuthorMore in Author Profile »Prior to joining Haver Analytics in 2000, Mr. Moeller worked as the Economist at Chancellor Capital Management from 1985 to 1999. There, he developed comprehensive economic forecasts and interpreted economic data for equity and fixed income portfolio managers. Also at Chancellor, Mr. Moeller worked as an equity analyst and was responsible for researching and rating companies in the economically sensitive automobile and housing industries for investment in Chancellor’s equity portfolio. Prior to joining Chancellor, Mr. Moeller was an Economist at Citibank from 1979 to 1984. He also analyzed pricing behavior in the metals industry for the Council on Wage and Price Stability in Washington, D.C. In 1999, Mr. Moeller received the award for most accurate forecast from the Forecasters' Club of New York. From 1990 to 1992 he was President of the New York Association for Business Economists. Mr. Moeller earned an M.B.A. in Finance from Fordham University, where he graduated in 1987. He holds a Bachelor of Arts in Economics from George Washington University.
More Economy in Brief


