 Global| Sep 29 2004
Canadian Industrial Product Prices Appear to Peak Out Following Surges in Petroleum & Metals
Summary
Industrial product prices in Canada were basically unchanged in August, rising just 0.1% from July. This not-seasonally-adjusted index is up 4.9% from August 2003 and seems to be moderating a bit after a substantial run-up during the [...]
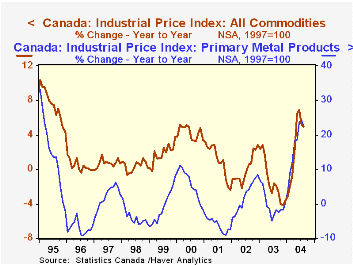
Industrial product prices in Canada were basically unchanged in August, rising just 0.1% from July. This not-seasonally-adjusted index is up 4.9% from August 2003 and seems to be moderating a bit after a substantial run-up during the spring and early summer.
Petroleum is an obvious culprit in the sharp upturn in this wholesale price index. As seen in the table below, petroleum and coal prices have surged more than 21% in the last 12 months. Large as this increase is, it is noticeably smaller than the peak year-on-year gain of 31% in May.
Petroleum products are not the only source of upward pressure on the array of industrial prices. Metals too have risen sharply. Beginning in June and July of last year, all the various metals prices turned very much higher. Nickel products began to rise in June 2003, copper, aluminum and "other" (mostly tin and lead) in July, and iron and steel products this past January. For Canada, these developments carry more weight than in the US. Mining and durable goods manufacturing in Canada account for approximately 14% of gross value added in the economy. In the US, by comparison, these two sectors comprise about 9-1/2% of GDP. These share calculations were done in chained dollars and are rough, since such shares are not technically additive in chained terms. But they give a general impression of the significance of these price movements to the two countries: nearly one-seventh of the Canadian economy is directly impacted by the oil and metal product prices, but less than one-tenth of the US economy. Notably, however, most metals prices began to slow in April and May. This eases cost pressures for some industries in Canada, but also pares revenue growth for the metals producers, making this sector a two-edged sword for the Canadian economy.
| Year/Year % Change | Aug 2004 | Jul 2004 | Jun 2004 | 2003 | 2002 | 2001 |
|---|---|---|---|---|---|---|
| Industrial Product Price Index | 4.9 | 5.2 | 6.9 | -3.5 | 2.8 | -2.4 |
| ex Petroleum & Coal | 3.8 | 3.9 | 5.6 | -3.6 | 1.6 | -0.3 |
| Petroleum & Coal | 21.1 | 25.2 | 27.4 | -2.4 | 26.2 | -29.3 |
| Primary Metals | 22.4 | 24.3 | 23.7 | 0.7 | 8.5 | -7.6 |
Carol Stone, CBE
AuthorMore in Author Profile »Carol Stone, CBE came to Haver Analytics in 2003 following more than 35 years as a financial market economist at major Wall Street financial institutions, most especially Merrill Lynch and Nomura Securities. She had broad experience in analysis and forecasting of flow-of-funds accounts, the federal budget and Federal Reserve operations. At Nomura Securities, among other duties, she developed various indicator forecasting tools and edited a daily global publication produced in London and New York for readers in Tokyo. At Haver Analytics, Carol was a member of the Research Department, aiding database managers with research and documentation efforts, as well as posting commentary on select economic reports. In addition, she conducted Ways-of-the-World, a blog on economic issues for an Episcopal-Church-affiliated website, The Geranium Farm. During her career, Carol served as an officer of the Money Marketeers and the Downtown Economists Club. She had a PhD from NYU's Stern School of Business. She lived in Brooklyn, New York, and had a weekend home on Long Island.
More Economy in Brief


