Global| Apr 10 2007
Bank of Japan Holds Policy Steady on Unanimous Vote…
Summary
Japans economy watchers survey shows the ongoing downshift in Japans economy from a local peak reached back in March of 2006. Since then, the economy has showed less strength but in the recent three months or so the economy [...]
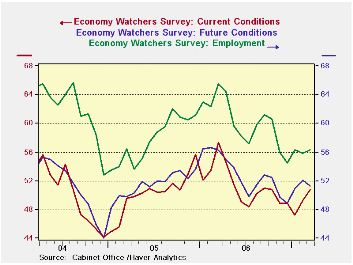
Japan’s economy watcher’s survey shows the ongoing downshift in Japan’s economy from a local peak reached back in March of 2006. Since then, the economy has showed less strength but in the recent three months or so the economy watcher’s index has showed some lift in its overall position as well as in its outlook. During this period job market conditions have remained positive and have stabilized. This index is one of the reasons that the Bank of Japan (BoJ) may remain confident that the economy is still doing alright despite some uneven reports early this year.
The indicators in the table below give a somewhat broader picture of the performance of the Japanese economy. The first panel of the chart shows the raw readings on several measures; the second panel re-expresses them as a percentile of the indicator’s own range of values over the past five years. For example the current economy watchers index shows the future component is in the 70th percentile (top 30%) of this five-year range of values. The other economy watcher indicators are near or above the 60th percentile, significantly above even the midpoint of their respective ranges (the 50th percentile mark is the mid-point). But the NTC MFG reading is relatively weaker at a 52.5 raw reading it shows some expansion. As a percentile of its five-year range it is weak, residing in only its 43rd percentile. The Teikoku indexes are relatively stronger. They are based on a more comprehensive weighting of questions put to survey participants. The MFG reading is in the 86th percentile of its range, much stronger than the NTC reading in its range. Also the services and construction readings are in the top 10 percentile of their respective ranges. Retailing is at a weaker but still firm 75th percentile.
The BoJ decision to keep rates on hold seems reasonable. The economy has had some uneven numbers but there has also been some new flirtation with deflation. The BoJ board seems to be trying to make sure that recovery is in gear before moving rates up as deputy governor Muto had previously promised. For the moment BOJ policy seem to be right where it needs to be.
| Raw readings of each survey | Percent of 5Year range* | ||||||
| Mar-07 | Feb-07 | Jan-07 | Dec-06 | Mar-07 | Feb-07 | Jan-07 | |
| Diffusion | |||||||
| Economy Watchers | 50.8 | 49.2 | 47.2 | 48.9 | 65.6% | 57.4% | 53.7% |
| Employment | 56.3 | 55.9 | 56.3 | 54.5 | 59.7% | 57.9% | 64.9% |
| Future | 51.3 | 52.1 | 50.9 | 48.9 | 70.6% | 75.0% | 68.3% |
| NTC MFG | 52.5 | -- | -- | -- | 43.5% | -- | -- |
| Econ Trends (Teikoku'/50 neutral/weighted diffusion)) | |||||||
| MFG | 47.2 | 46.7 | 46.7 | 47.6 | 86.2% | 84.5% | 85.2% |
| Retail | 41.1 | 39.9 | 39.8 | 39.4 | 74.3% | 69.9% | 69.3% |
| Wholesale | 44.6 | 43.8 | 44.1 | 44.8 | 85.8% | 82.1% | 84.8% |
| Services | 49.9 | 49.4 | 48.9 | 49.3 | 92.2% | 90.2% | 88.5% |
| Construction | 38.7 | 38.7 | 38.2 | 39.0 | 91.2% | 91.0% | 88.6% |
| 100 is high; Zero is low | |||||||
by Robert Brusca April 10, 2007
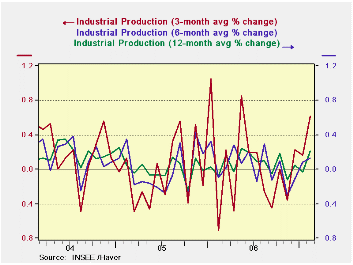
French industrial output was up especially strong rising by 1.1% and led by a 1.2% increase in the output of consumer goods. EU IP trends have been soft recently. Even Germany where conditions have been rather solid has showed some weakness in consumer goods output; of course Germany may still be fighting its way though some VAT effects early in the year. With this strong gain in February, France at least shows that one large EU country has some solid output growth in consumer goods. This has been led by autos where output is up by a strong 4.7% spurt in February alone.
For France the chart now shows some building momentum trends in place as the 3-mo growth rate is rising sharply and the six month pace is firming along with the Yr/Yr pace.
In February France demonstrates good growth across sectors. Auto output is especially strong. Consumer goods output is surprisingly robust as that sector had lagged. Capital goods output trends are simply steady and above the pace of 4%. Intermediate goods output has picked up in February.
| SAAR except m/m | Feb-07 | Jan-07 | Dec-06 | 3-mo | 6-mo | 12-mo |
| IP total | 1.1% | -0.2% | 1.0% | 7.7% | 1.6% | 2.6% |
| Consumer | 1.2% | 0.4% | 0.0% | 6.4% | 2.9% | 2.3% |
| Capital | 0.3% | 0.4% | 0.5% | 4.8% | 4.4% | 4.6% |
| Intermediary | 1.3% | -1.2% | 1.4% | 6.3% | 1.2% | 3.5% |
| Memo | ||||||
| Auto | 4.7% | 0.4% | 1.5% | 29.9% | 3.9% | 4.5% |
by Louise Curley April 10, 2007
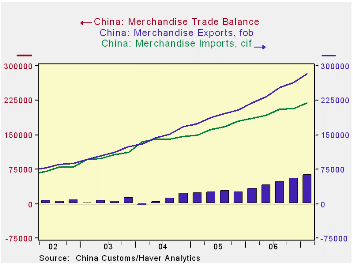
China's merchandise trade balance fell sharply in March to $84.7 billion from $108.0 billion in February. Exports fell by $23.4 billion and imports rose by $0.3 billion. As the data are not seasonally adjusted, the monthly ups and downs in the first quarter of the year are frequently affected by the variations in the dates of the Chinese New Year.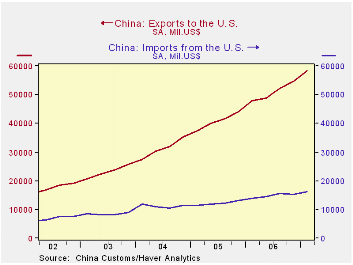 In spite of the decline in the March trade balance, the balance for the whole quarter was a record at $63.7 billion, $7.5 billion above the previous quarter and $30.7 above the first quarter of 2006. The first chart shows China's merchandise exports, imports and balances of trade in goods over the past five years on a quarterly basis.
The surplus with the US was $42 billion in the first quarter of this year, $2.6 billion above the previous quarter and $7.8 billion above the first quarter of 2006. 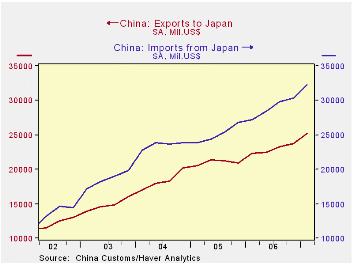 The growing surplus with the U.S. has been causing friction between China and the US over the last several years and has reached the point where the US has recently increased duties on Chinese coated paper and, just yesterday, filed two cases with the WTO (World Trade Organization) to reduce barriers to US goods and to criminalize piracy. The second chart shows the widening gap between China's exports to the US and its imports from the US.
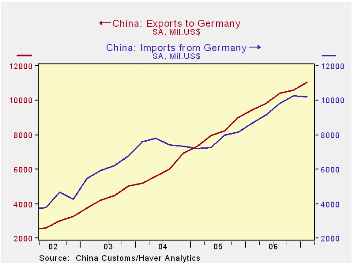
In contrast to the US, China has run a deficit with Japan as shown in the third chart. Until 2005, China also ran a deficit in goods with Germany. Since then, however, China has been recording a growing surplus with Germany as shown in the fourth chart.
| CHINA TRADE IN GOODS (Bil US$) |
Mar 07 | Feb 07 | Mar 06 | M/M Dif | Y/Y Dif | Q1 07 | Q4 06 | Q1 06 | Q/Q Dif | Y/Y Dif | 2006 |
|---|---|---|---|---|---|---|---|---|---|---|---|
| Export Total | 84.7 | 108.0 | 76.5 | -23.4 | 8.2 | 282.9 | 263.6 | 219.0 | 19.3 | 63.9 | 969.0 |
| To US | 16.8 | 21.4 | 16.9 | -4.6 | -0.1 | 58.2 | 54.7 | 47.9 | 3.5 | 10.3 | 203.5 |
| To Germany | 3.0 | 4.3 | 3.3 | -1.3 | -0.3 | 11.1 | 10.6 | 9.5 | 0.5 | 1.6 | 40.3 |
| To Japan | 7.1 | 9.3 | 7.5 | -2.1 | -0.4 | 25.1 | 23.8 | 22.3 | 1.3 | 2.8 | 91.8 |
| Imports Total | 74.2 | 73.9 | 63.3 | 0.3 | 10.9 | 219.3 | 207.4 | 168.1 | 11.9 | 51.2 | 791.5 |
| From US | 6.1 | 4.9 | 4.8 | 1.3 | 1.6 | 16.3 | 15.4 | 13.8 | 0.9 | 2.5 | 59.2 |
| From Germany | 3.4 | 3.6 | 2.8 | -0.2 | 0.6 | 10.2 | 10.3 | 8.7 | -0.1 | 1.5 | 37.9 |
| From Japan | 10.9 | 10.8 | 9.2 | 0.1 | 1.7 | 32.3 | 30.4 | 27.2 | 1.9 | 5.1 | 115.8 |
| Balance Total | 10.4 | 34.1 | 13.1 | -23.6 | -2.7 | 63.7 | 56.1 | 32.9 | 7.5 | 30.7 | 177.4 |
| US | 10.7 | 16.5 | 12.1 | -5.8 | -1.4 | 42.0 | 39.3 | 34.1 | 2.6 | 7.8 | 144.3 |
| Germany | -0.4 | 0.7 | 0.5 | -1.1 | -0.9 | 0.9 | 0.3 | 0.8 | 0.6 | 0.1 | 2.4 |
| Japan | -3.8 | -1.5 | -1.7 | -2.3 | -2.1 | -7.2 | -6.6 | -4.9 | -0.5 | -2.3 | -24.0 |

Robert Brusca
AuthorMore in Author Profile »Robert A. Brusca is Chief Economist of Fact and Opinion Economics, a consulting firm he founded in Manhattan. He has been an economist on Wall Street for over 25 years. He has visited central banking and large institutional clients in over 30 countries in his career as an economist. Mr. Brusca was a Divisional Research Chief at the Federal Reserve Bank of NY (Chief of the International Financial markets Division), a Fed Watcher at Irving Trust and Chief Economist at Nikko Securities International. He is widely quoted and appears in various media. Mr. Brusca holds an MA and Ph.D. in economics from Michigan State University and a BA in Economics from the University of Michigan. His research pursues his strong interests in non aligned policy economics as well as international economics. FAO Economics’ research targets investors to assist them in making better investment decisions in stocks, bonds and in a variety of international assets. The company does not manage money and has no conflicts in giving economic advice.
More Economy in Brief