 Global| Dec 07 2005
Australian GDP Slows to 0.2% Growth in Q3, But Q2's 1.3% Was Strong
Summary
The Australian economy expanded a mere 0.2% in Q3, according to data reported at midday today, Canberra time. This was the smallest quarterly increase in a year. Australian GDP data are expressed in chained A$, with fiscal 2004 as the [...]
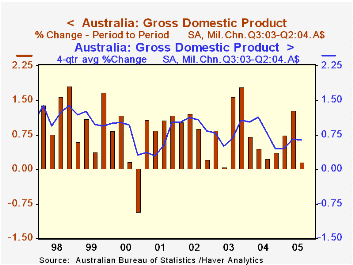
The Australian economy expanded a mere 0.2% in Q3, according to data reported at midday today, Canberra time. This was the smallest quarterly increase in a year. Australian GDP data are expressed in chained A$, with fiscal 2004 as the reference year, Q3 2003 to Q2 2004. Press reports and market participants focused on the "slow" advance, and the A$ fell in foreign exchange markets.
However, Q2 growth was an outsized 1.3%, and as seen in the table below, included sizable gains in private fixed investment, 6.7%, and government consumption, 1.3%. Thus, the small Q3 result could mark a return to a more normal path, rather than a cyclical weakening. The investment item slowed to a 0.5% increase in Q3 and government spending decreased by 0.6%. Exports were also strong in both Q1 and Q2, so their shrinkage in Q3 could also be more a reaction to that strength than a turn toward a new trend. In the meantime, household consumption is growing fairly steadily, with 0.6% in both Q2 and Q3, making a 2.8% annualized rate for the first three quarters of this year.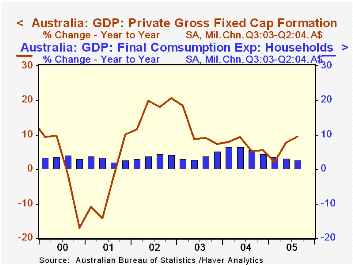
Even with the moderation in Q3, the capital formation figures highlight strength in business investment generally. Nonresidential buildings and other structures are up 24.5% from a year ago, showing 2005 as a rebound year after a slowdown last year to "only" 4.2% growth. Five-year expansion of those capital investments has run at an 8.7% annual rate. Machinery and equipment expenditures have had an erratic quarterly pattern, down in Q1, up 10.6% in Q2 and up a slim 1.5% in Q3, but they are running 15% above a year ago, close in line with 16% over the past four years.
Thus, despite the Q3 slowdown, the Australian economy looks vigorous, with growth in several diverse sectors. Obviously, though, as with all countries, prospects for the months ahead are clouded with the high cost of energy.
| Australia GDP Chain 2003/04 A$ |
Q3 2005 | Q2 2005 | Q1 2005 | From Q3 2004 | 2004 | 2003 | 2002 |
|---|---|---|---|---|---|---|---|
| Real GDP | 0.2 | 1.3 | 0.7 | 2.6 | 3.5 | 3.1 | 4.1 |
| Consumption: Households | 0.6 | 0.6 | 0.8 | 2.7 | 5.7 | 3.8 | 3.9 |
| Government | -0.6 | 1.3 | -0.1 | 1.6 | 3.7 | 3.7 | 3.1 |
| Private Fixed Capital Form. | 0.5 | 6.7 | -1.6 | 9.5 | 6.9 | 10.7 | 17.7 |
| Public Fixed Capital Form. | -5.2 | -0.2 | 1.5 | 0.2 | 13.1 | -0.8 | 5.9 |
| Exports | -2.3 | 2.0 | 1.0 | 2.6 | 4.0 | -2.2 | 0.0 |
| -Imports | -0.5 | 2.0 | 1.6 | 8.3 | 15.1 | 10.5 | 10.7 |
| Domestic Final Demand | 0.2 | 2.0 | 0.2 | 3.8 | 5.9 | 5.0 | 6.4 |
| Gross Value Added | 0.0 | 1.2 | 0.4 | 1.9 | 3.8 | 2.6 | 4.1 |
Carol Stone, CBE
AuthorMore in Author Profile »Carol Stone, CBE came to Haver Analytics in 2003 following more than 35 years as a financial market economist at major Wall Street financial institutions, most especially Merrill Lynch and Nomura Securities. She had broad experience in analysis and forecasting of flow-of-funds accounts, the federal budget and Federal Reserve operations. At Nomura Securities, among other duties, she developed various indicator forecasting tools and edited a daily global publication produced in London and New York for readers in Tokyo. At Haver Analytics, Carol was a member of the Research Department, aiding database managers with research and documentation efforts, as well as posting commentary on select economic reports. In addition, she conducted Ways-of-the-World, a blog on economic issues for an Episcopal-Church-affiliated website, The Geranium Farm. During her career, Carol served as an officer of the Money Marketeers and the Downtown Economists Club. She had a PhD from NYU's Stern School of Business. She lived in Brooklyn, New York, and had a weekend home on Long Island.
More Economy in Brief


