 Global| Sep 08 2006
August U.S. Vehicle Sales Reversed July's Gain
by:Tom Moeller
|in:Economy in Brief
Summary
US light vehicle sales last month reversed all of July's revised gain and fell 6.5% to 16.07M units, according to the Autodata Corporation. During the first eight months of this year vehicle sales averaged 16.63M, down 4.3% from the [...]
US light vehicle sales last month reversed all of July's revised gain and fell 6.5% to 16.07M units, according to the Autodata Corporation. During the first eight months of this year vehicle sales averaged 16.63M, down 4.3% from the first eight months of 2005.
Overall light truck sales dropped 6.6% last month. Higher gasoline prices have prompted the 9.7% decline in light truck sales year to date versus the first eight months of last year.
Sales of the relatively fuel efficient imported light trucks posted a large 11.6% (+4.2% y/y) decline last month but remained up 7.5% year to date. Domestic truck sales fell 5.7% and reversed a July gain (-9.9% y/y). During the first eight months of this year domestic light truck sales fell 12.2% from the first eight months of 2005 to an average of 7.47M.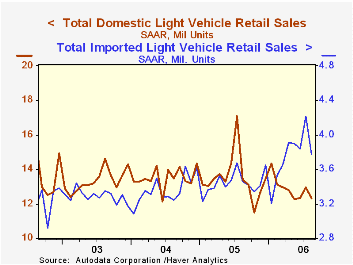
Auto sales fell 6.4% (-0.7% y/y) in August and fully reversed the July increase. Domestic car sales fell 4.5% (-5.9% y/y) and year to date sales were down 0.5% versus last year. Sales of imported autos also reversed the July gain with a 10.1% (+11.8% y/y) but year to date are up 10.0%.
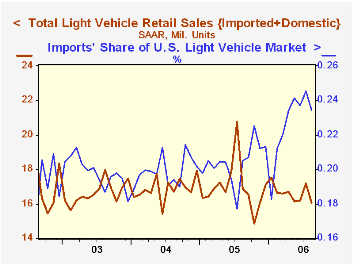
Imports garnered 23.5% of the US light vehicle market during August, down slightly from the July monthly record. Last year, imports' share of the U.S. vehicle market totaled 20.4%
Minutes of the Federal Reserve Board's discount rate meetings from July 17 through August 7, 2006 can be found here.
| Light Vehicle Sales (SAAR, Mil. Units) | August | July | Y/Y | 2005 | 2004 | 2003 |
|---|---|---|---|---|---|---|
| Total | 16.06 | 17.19 | -4.7% | 16.96 | 16.87 | 16.63 |
| Autos | 7.69 | 8.22 | -0.7% | 7.65 | 7.49 | 7.62 |
| Trucks | 8.37 | 8.96 | -8.1% | 9.32 | 9.37 | 9.01 |
by Carol Stone September 8, 2006
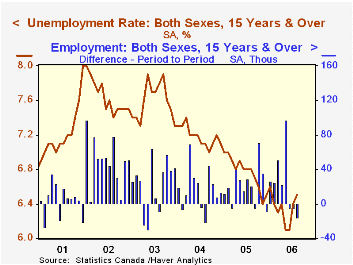
In August, Canadian labor markets extended into a third month their correction of the May employment spike, as shown in StatCan data reported this morning. Employment fell by 16,000 in August, after two consecutive decreases of 5,000. These followed a spurt of 97,000 in May. The unemployment rate ticked up from 6.4% in July to 6.5% last month, while participation in the labor force reverted from 67.3% of the total labor force to 67.2% (All these data cover the population 15 and over; participation for the "working age" population, ages 15-64, is 77.9%).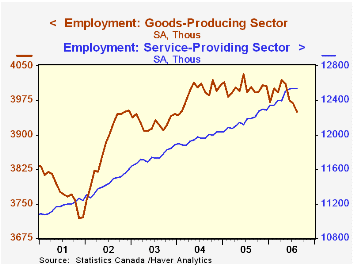
A month ago, we tried to "explain away" the employment decline and bump-up in unemployment as mere corrections to the huge gains in May. Extending this interpretation to a third month may seem to be reaching or trying to evade some hint of genuine slowdown. However, the fact remains that the recent relative weakness in employment is coming in the industries that spiked the most in May: finance, insurance & real estate; health care; and public administration. The finance and real estate sector is surely cyclical and subject to buffeting by market forces, but health care and government are not. Health care, though, seems to have become more volatile in the last couple of years, making it hard to draw any substantive conclusion.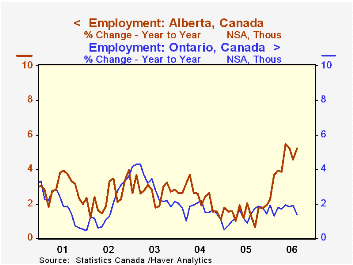
What we do see in Canada fairly unequivocally, though, is a major downward thrust in goods-producing industries. Back at the turn of the year, it looked that manufacturing might be trying to stabilize, but this was short-lived, and by May it was falling once again. Other industries in that sector -- agriculture, construction, etc. -- did show increases through the end of 2005, but they have flattened since, even the forestry and mining group, which now has 1,500 fewer workers than in December 2005. It had gained more than 25,000 over last year, but apparently the oil-price inspired build-up has faded. Provincial data seem to confirm that, showing a plateau in employment in energy-rich Alberta, British Columbia and Saskatchewan; the number of workers is falling gently from month to month in the business centers of Ontario and Quebec and contracting more definitively in the Maritimes.
Canada's nationwide data are contained in Haver's CANSIM database, and the Provinces are covered in CANSIMR.
| Canada (Seasonally Adjusted) | Aug 2006 | Jul 2006 | June 2006 | May 2006 | Year Ago | 2005 | 2004 | 2003 |
|---|---|---|---|---|---|---|---|---|
| Employment (000s) | 16,489 | 16,505 | 16,510 | 16,515 | 16,201 | 16,170 | 15,947 | 15,672 |
| Change, 000s/% | -16 | -5 | -5 | +97 | 1.7% | 1.4% | 1.8% | 2.4% |
| Goods-Producing | -18 | -7 | -35 | -10 | -1.4% | 0.2% | 1.7% | 1.2% |
| Service-Producing | +2 | +2 | +30 | +106 | 2.8% | 2.1% | 1.8% | 2.7% |
| Unemployment (000s) | 1,141 | 1,137 | 1,067 | 1,073 | 1,178 | 1,173 | 1,235 | 1,286 |
| Unemployment Rate (%) | 6.5 | 6.4 | 6.1 | 6.1 | 6.8 | 6.8 | 7.2 | 7.6 |
| Participation Rate (%) | 67.2 | 67.3 | 67.2 | 67.3 | 67.2 | 67.2 | 67.5 | 67.5 |

Tom Moeller
AuthorMore in Author Profile »Prior to joining Haver Analytics in 2000, Mr. Moeller worked as the Economist at Chancellor Capital Management from 1985 to 1999. There, he developed comprehensive economic forecasts and interpreted economic data for equity and fixed income portfolio managers. Also at Chancellor, Mr. Moeller worked as an equity analyst and was responsible for researching and rating companies in the economically sensitive automobile and housing industries for investment in Chancellor’s equity portfolio. Prior to joining Chancellor, Mr. Moeller was an Economist at Citibank from 1979 to 1984. He also analyzed pricing behavior in the metals industry for the Council on Wage and Price Stability in Washington, D.C. In 1999, Mr. Moeller received the award for most accurate forecast from the Forecasters' Club of New York. From 1990 to 1992 he was President of the New York Association for Business Economists. Mr. Moeller earned an M.B.A. in Finance from Fordham University, where he graduated in 1987. He holds a Bachelor of Arts in Economics from George Washington University.
More Economy in Brief


