 Global| Dec 18 2006
Another Record U.S. Current Account Deficit in 3Q
by:Tom Moeller
|in:Economy in Brief
Summary
Last quarter the US current account deficit posted a new record of $225.6B versus a revised 2Q deficit of $217.1B which was slightly shallower than initially reported. The figure matched Consensus expectations for a 3Q deficit of [...]
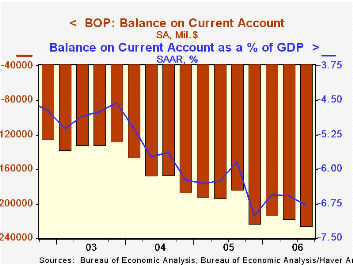
Last quarter the US current account deficit posted a new record of $225.6B versus a revised 2Q deficit of $217.1B which was slightly shallower than initially reported. The figure matched Consensus expectations for a 3Q deficit of $225B.
The deficit last quarter equaled 6.8% of GDP and so far this year has averaged 6.64% versus 6.35% during all of last year .
The deficit in merchandise trade deteriorated to $218.6B from an unrevised 2Q deficit of $210.6B. Exports grew 3.6% (16.5% y/y) yet that strong gain was again offset by a 3.7% surge in imports (13.5% y/y).
Last quarter, higher oil prices caused the balance in petroleum trade to deteriorate to $75.2B from $71.4B during 2Q. The nonpetroleum trade balance reversed all of its 2Q improvement and fell to $138.7B which was just shy of the record set during last year's fourth quarter.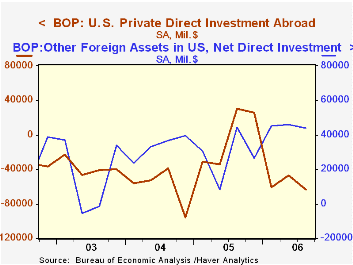
The surplus in services trade improved sharply to a surplus of $18.3B from a revised $17.5B during 2Q which was better than initially estimated. Exports of services grew just 0.9% (8.5% y/y) last quarter but services imports grew an even smaller 0.1% (8.6% y/y).
The U.S. capital account improved q/q though the net US foreign direct investment balance deteriorated. U.S. direct investment abroad rose 35% to $$63.1B (37.7% y/y). Foreign direct investment in the US, however, increased $44.1B, less than the $45.8B increase during 2Q.
Would Protectionism Defuse Global Imbalances and Spur Economic Activity? from the Federal Reserve Bank of New York is available here.
Should We Worry About the Current Account Deficit? from the Federal Reserve Bank of Richmond can be found here.
How Dangerous is the U.S. Current Account Deficit? from the Federal Reserve Bank of St. Louis is available here.
| US Int'l Balance of Payments | 3Q '06 | 2Q '06 | Y/Y | 2005 | 2004 | 2003 |
|---|---|---|---|---|---|---|
| Current Account Deficit | $225.6 | $217.1B | $183.4B (3Q'05) | $791.5B | $665.3B | $527.5B |
| Goods/Services/Income Deficit | $204.1 | $195.3B | $174.0B (3Q'05) | $705.4B | $583.7B | $458.3B |
| Exports | 2.9% | 5.7% | 19.0% | 14.6% | 15.7% | 5.9% |
| Imports | 3.4% | 4.3% | 18.5% | 16.3% | 18.7% | 7.4% |
| Unilateral Transfers Deficit | $21.5B | $21.9B | $9.5B (3Q'05) | $86.1B | $81.6B | $69.2B |
by Louise Curley December 18, 2006
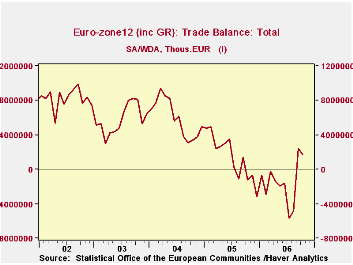
The Euro Zone's surplus on trade in October declined to 1,710.7 million euros from 2,418.0 million euros in September, but was 2,927.8 million euros above the deficit of 1,217.1 million euros in October, 2005. The traditional surplus on trade that the Euro Zone had enjoyed was turned into a deficit in mid 2005, due in part to increased oil imports and in part to the unrelenting surge in imports from China. The first chart shows the balance of trade for the Euro Zone with the rest of the world.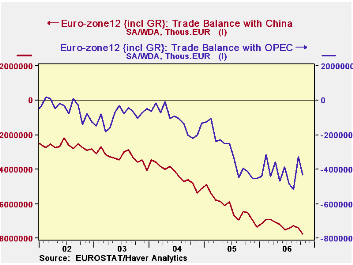
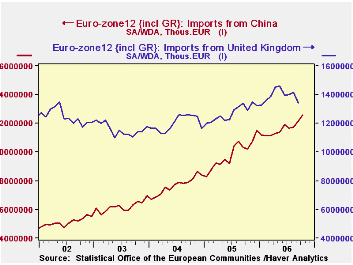
As the second chart shows the deficit with OPEC appears to have stabilized in recent months, but that with China continues to widen. Imports from China now exceed those from the United States, which had been the largest source of imports after the United Kingdom. The third chart compares imports from China with those from the US. While imports from China are now lower than those from the UK, the recent growth in these imports suggest it will not be too long before they exceed imports from the UK as can be seen in the fourth chart.
The imbalances resulting from China's growing surplus on its trade account with the Euro Zone is adding to the pressure already being exerted by the US to appreciate the Chinese Yuan.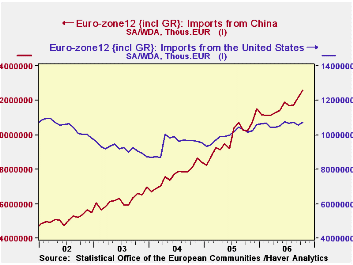
| EURO ZONE TRADE IN GOODS (Mil. Euro) | Oct 06 | Sep 06 | Oct 05 | M/M % | Y/Y % | 2005 | 2004 | 2003 |
|---|---|---|---|---|---|---|---|---|
| Balance of Trade | 1,710.7 | 2,418.0 | -1,217.1 | -702.3* | 2,927.8* | 16,835.0 | 71,537.1 | 69,723.3 |
| China | -7,764.8 | -7,391.0 | -6,512.4 | -373.8* | -1,252.4* | -74,705.5 | -51,792.9 | -39,279.3 |
| OPEC | -4,321.9 | -3,265.7 | -4,130.3 | -1,056.2* | -191.6* | -36,858.0 | -13,422.0 | -10,731.9 |
| Imports | 118,727.7 | 117,964.5 | 106,537.8 | 0.65 | 11.44 | 1,224,700 | 1,075,342 | 990,435 |
| US | 10,725.0 | 10,557.8 | 10,144.6 | 1.58 | 5.72 | 120,158.3 | 113,775.4 | 110,326.1 |
| China | 12,582.8 | 12,170.7 | 10,231.3 | 3.39 | 22.98 | 118,120.7 | 92,060.4 | 74,515.0 |
| UK | n.a. | 13,430.2 | 12,888.2 | n.a. | n.a. | 152,360.0 | 144,047.1 | 138,863.4 |

Tom Moeller
AuthorMore in Author Profile »Prior to joining Haver Analytics in 2000, Mr. Moeller worked as the Economist at Chancellor Capital Management from 1985 to 1999. There, he developed comprehensive economic forecasts and interpreted economic data for equity and fixed income portfolio managers. Also at Chancellor, Mr. Moeller worked as an equity analyst and was responsible for researching and rating companies in the economically sensitive automobile and housing industries for investment in Chancellor’s equity portfolio. Prior to joining Chancellor, Mr. Moeller was an Economist at Citibank from 1979 to 1984. He also analyzed pricing behavior in the metals industry for the Council on Wage and Price Stability in Washington, D.C. In 1999, Mr. Moeller received the award for most accurate forecast from the Forecasters' Club of New York. From 1990 to 1992 he was President of the New York Association for Business Economists. Mr. Moeller earned an M.B.A. in Finance from Fordham University, where he graduated in 1987. He holds a Bachelor of Arts in Economics from George Washington University.
More Economy in Brief


