 Global| Nov 28 2006
Air Came Out of U.S. Durable Orders, Tech Off As Well
by:Tom Moeller
|in:Economy in Brief
Summary
An 8.3% decline in new orders for durable goods last month more than reversed an upwardly revised 8.7% surge during September. The volatility largely reflected first the near-tripling of civilian aircraft & parts orders during [...]
An 8.3% decline in new orders for durable goods last month more than reversed an upwardly revised 8.7% surge during September. The volatility largely reflected first the near-tripling of civilian aircraft & parts orders during September then a 37.4% decline last month. Consensus expectations had been for a 5.0% in total orders during October.
Additional weakness last month was provided by a 10.2% (+3.3% y/y) decline in orders for computers & electronic products that very much reflected a 25.6% (-24.6% y/y) drop in computers.
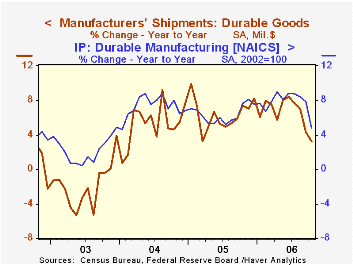
During the last ten years there has been a 69% correlation between the y/y change in durable goods orders and the change in output of durable goods..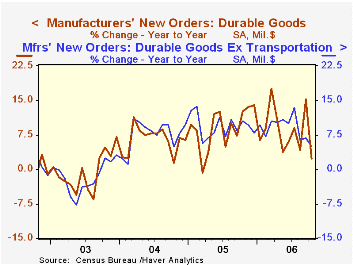
Orders for nondefense capital goods dropped 15.6% and less aircraft they were off 5.1%. Offsetting the slide in computer orders was a 1.4% (13.4% y/y) increase in new orders for machinery and a 5.1% (8.4% y/y) rise in electrical equipment & appliances. During the last ten years there has been an 86% correlation between the y/y change in capital goods orders less aircraft and the y/y change in business fixed investment in equipment & software from the GDP accounts.
Orders for motor vehicles & parts rose 1.4% (-9.5% y/y) while primary metals orders increased 1.1% (7.4% y/y).
Durable goods orders less transportation fell 1.7% after an upwardly revised 0.5% October increase. Consensus expectations had been for a 0.1% rise in total orders less transportation.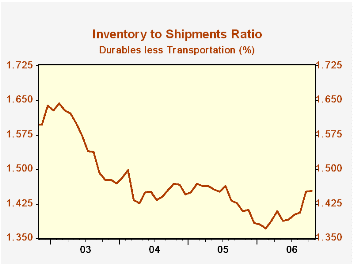
Shipments of durable goods increased a slight 0.6% (3.3% y/y) after a little revised 2.7% October tumble. Less the transportation sector shipments rose a similar 0.5% (5.8% y/y) after a 2.2% slide the prior month. During the last ten years there has been an 82% correlation between the y/y change in durable goods shipments and the change in industrial production of durable goods.
Order backlogs rose another 1.2% (21.8% y/y) and less transportation rose 0.9% (13.2% y/y). Unfilled orders for nondefense aircraft & parts surged by 2.4% (53.9% y/y).
Durable inventories rose 0.8% (8.2% y/y). Less the transportation sector inventories rose 0.6% (9.1% y/y) and the inventory to shipments ratio outside of transportation added to its September surge.
| NAICS Classification | October | September | Y/Y | 2005 | 2004 | 2003 |
|---|---|---|---|---|---|---|
| Durable Goods Orders | -8.3% | 8.7% | 2.3% | 9.0% | 6.4% | -0.6% |
| Excluding Transportation | -1.7% | 0.5% | 4.9% | 9.4% | 7.6% | -1.7% |
| Nondefense Capital Goods | -15.6% | 24.7% | 8.5% | 21.4% | 5.6% | -3.4% |
| Excluding Aircraft | -5.1% | 3.2% | 6.2% | 12.3% | 2.8% | -2.0% |
by Tom Moeller November 28, 2006
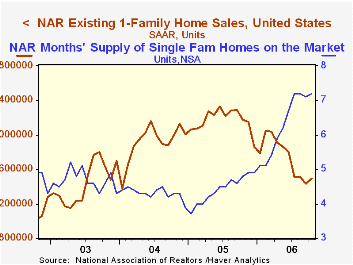
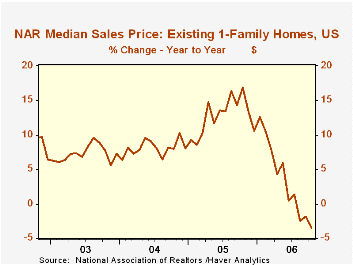 Most of last month's rise in single family home sales was due to a 7.1% (-18.8% y/y) recovery in sales in the West. Sales also ticked up 0.8% (-10.7% y/y) in the Midwest. In the Northeast sales slid another 1.3% (-7.5% y/y) and down South sales slipped 0.9% 9-7.6% y/y).
The inventory of unsold existing single family homes increased 1.9% (32.7% y/y) after two months of decline and rose to 7.2 months' supply on the market.
The latest release from the National Association of Realtors is available here.
Most of last month's rise in single family home sales was due to a 7.1% (-18.8% y/y) recovery in sales in the West. Sales also ticked up 0.8% (-10.7% y/y) in the Midwest. In the Northeast sales slid another 1.3% (-7.5% y/y) and down South sales slipped 0.9% 9-7.6% y/y).
The inventory of unsold existing single family homes increased 1.9% (32.7% y/y) after two months of decline and rose to 7.2 months' supply on the market.
The latest release from the National Association of Realtors is available here.
The Economic Outlook and Monetary Policy from Charles I. Plosser President of the Federal Reserve Bank of Philadelphia can be found here.
| Existing Home Sales (000, AR) | October | September | Y/Y | 2005 | 2004 | 2003 |
|---|---|---|---|---|---|---|
| Total Home Sales | 6,240 | 6,210 | -11.5% | 7,064 | 6,722 | 6,176 |
| Single Family Home Sales | 5,500 | 5,430 | -11.0% | 6,170 | 5,912 | 5,443 |
| Single Family Median Home Price (000) | $221.3 | $221.1 | -3.4% | $217.5 | $192.8 | $178.3 |
by Tom Moeller November 28, 2006
The Conference Board reported that November consumer confidence fell 2.1% to 102.9 following a downwardly revised 0.8% slip during October. The decline ran counter to Consensus expectations for an increase to 106.4.
During the last twenty years there has been a 52% correlation between the level of consumer confidence and the y/y change in real consumer spending. The correlation rose to 66% during the last ten years.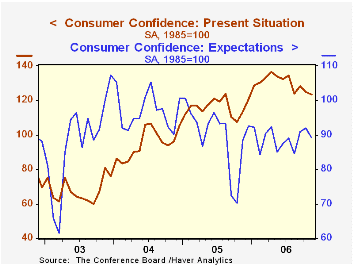
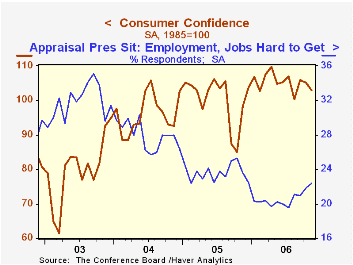
Consumers' assessment of the present situation fell 1.2% (+9.2% y/y) for the second consecutive monthly drop. The percentage of respondents who viewed business conditions as good (26.5%) fell but the percentage that viewed jobs as hard to get (22.4%) rose to the highest level this year.
The index measuring consumers' expectations fell for the first month in the last three (+0.9% y/y). Expectations of better business conditions in six months fell hard to the lowest level in over a year.
The expected inflation rate in twelve months fell to 4.7%, the lowest since July of 2005.
The Conference Board’s survey isconducted by a mailed questionnaire to 5,000 households and about 3,500 typically respond.
The Economic Outlook, today's remarks by Fed Chairman Ben S. Bernanke, are available here.
| Conference Board | November | October | Y/Y | 2005 | 2004 | 2003 |
|---|---|---|---|---|---|---|
| Consumer Confidence | 102.9 | 105.1 | 4.7% | 100.3 | 96.1 | 79.8 |
by Tom Moeller November 28, 2006
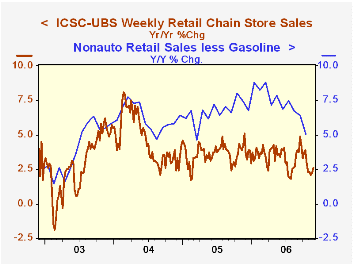
The ICSC-UBS retail chain-store sales index is constructed using the same-store sales (stores open for one year) reported by 78 stores of seven retailers: Dayton Hudson, Federated, Kmart, May, J.C. Penney, Sears and Wal-Mart.
The leading indicator of chain store sales from ICSC-UBS fell 0.3% (+0.1% y/y) after two week's of respectable increase.
| ICSC-UBS (SA, 1977=100) | 11/25/06 | 11/18/06 | Y/Y | 2005 | 2004 | 2003 |
|---|---|---|---|---|---|---|
| Total Weekly Chain Store Sales | 466.5 | 468.3 | 2.6% | 3.6% | 4.7% | 2.9% |
by Tom Moeller November 28, 2006
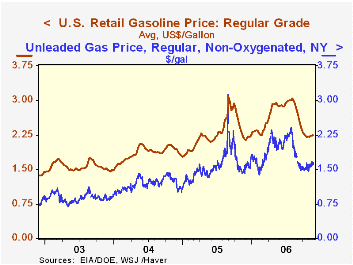
How Resilient Is The Modern Economy to Energy Price Shocks? from the Federal Reserve Bank of Atlanta is available here.
| Weekly Energy Prices | 11/27/06 | 11/20/06 | Y/Y | 2005 | 2004 | 2003 |
|---|---|---|---|---|---|---|
| US Retail Gasoline Price, Regular | $2.25 | $2.24 | 4.3% | $2.27 | $1.85 | $1.56 |
by Louise Curley November 28, 2006
The recent rapid fall of the U. S. dollar, particularly against the Euro and the British Pound has sent tremors in the financial world. Is this the beginning of a more extended fall in the dollar? Will China change its policy of minimal appreciation? What will be the impact on the recovery in Europe? What will be the impacts on the U. S. consumer and on U. S. inflation? How will central banks react? While this short note cannot begin to address these questions, what it can do is point to some of the data that will provide useful background.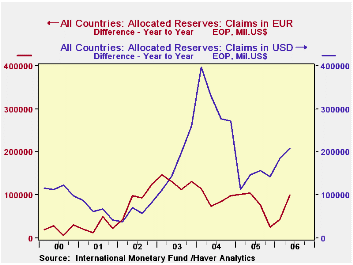
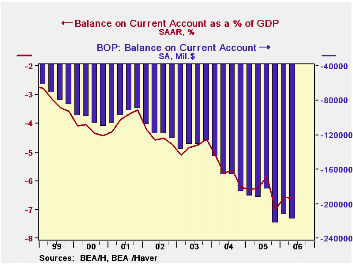
A root cause of the dollar's decline is the enormous U. S. balance of payments deficit as shown in the first chart and found in the Haver data bases USECON and USINT. Currently the deficit is 6.6% of Gross Domestic Product. However, the threat to the dollar from this source has been kept at bay, by the willingness of those countries with whom the U. S. has a deficit to hold their surpluses in dollar denominated instruments. Some of these countries are beginning to diversify their holdings from dollar assets to particularly euro assets. Of the allocated reserves published by the International Monetary Fund and reported in the Haver data base IFS, the year to year increases in the dollar and euro holdings are shown in the second chart. While the year to year increases in dollar holdings still exceed those of euro holdings, the excess increase of dollar holding has declined significantly since early 2005. Data on the major foreign holders of U. S. Treasury securities are found in the Haver data base USINT, Chart three shows the annual changes in the holdings of US Treasuries by China and Japan. While China has reduced its annual additions Japan has actually been reducing its holdings.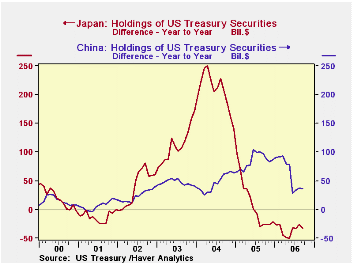
Finally, the movement of exchange rates can be monitored using the Haver data bases DAILY and INTDAILY. The recent fall of the dollar has been uneven with Europe bearing the major appreciation. The Euro hit a recent low relative to the U. S. dollar on October 10 when the euro was equivalent to 1.2502 U.S. dollars. In the month and a half since then, the euro has appreciated 4.9% to 1.312. The UK pound has appreciated almost as much, 4.4%, and now stands at $1.9369. The changes in Asian currencies have been more varied and more muted. The Japanese Yen, the South Korean Won, the Thai Baht, the Singapore dollar and the Indian Rupee have appreciated between 2.5 and 3.1% during this period. The Malaysian ringgit appreciated 1.74% and the Philippine peso, 0.80%. Among the Greater China group, the Taiwan dollar appreciated 1.19%, the Chinese Yuan 0.86% and Hong Kong a mere 0.22%.
| EXCHANGE RATES | Oct 10 06 | Nov 27 06 | Appreciation % |
|---|---|---|---|
| Euro (U.S. Dollar) | 1.2502 | 1.3120 | 4.94 |
| UK Pound (U.S. Dollar) | 1.8548 | 1.9368 | 4.42 |
| Japanese Yen (Yen/USD) | 119.18 | 116.12 | 3.07 |
| South Korea Won (Won/USD) | 959.2 | 930.3 | 3.11 |
| Thailand Baht (Baht/USD) | 37.46 | 36.44 | 2.80 |
| Singapore $ (S$/USD) | 1.5904 | 1.5494 | 2.65 |
| India Rupee (Rupee/USD) | 45.67 | 44.56 | 2.49 |
| Malaysia Ringgit (Ringgit/USD) | 3.693 | 3.630 | 1.74 |
| Taiwan $ (T$/USD) | 33.09 | 32.70 | 1.19 |
| Hong Kong $ (HK$/USD) | 7.7928 | 7.7760 | 0.22 |
| China Yuan (Yuan/USD) | 7.9100 | 7.8426 | 0.86 |

Tom Moeller
AuthorMore in Author Profile »Prior to joining Haver Analytics in 2000, Mr. Moeller worked as the Economist at Chancellor Capital Management from 1985 to 1999. There, he developed comprehensive economic forecasts and interpreted economic data for equity and fixed income portfolio managers. Also at Chancellor, Mr. Moeller worked as an equity analyst and was responsible for researching and rating companies in the economically sensitive automobile and housing industries for investment in Chancellor’s equity portfolio. Prior to joining Chancellor, Mr. Moeller was an Economist at Citibank from 1979 to 1984. He also analyzed pricing behavior in the metals industry for the Council on Wage and Price Stability in Washington, D.C. In 1999, Mr. Moeller received the award for most accurate forecast from the Forecasters' Club of New York. From 1990 to 1992 he was President of the New York Association for Business Economists. Mr. Moeller earned an M.B.A. in Finance from Fordham University, where he graduated in 1987. He holds a Bachelor of Arts in Economics from George Washington University.
More Economy in Brief


