 Global| Nov 01 2006
ADP Reported Hiring Improved During October
by:Tom Moeller
|in:Economy in Brief
Summary
The payroll processor ADP reported that the Nat'l Employment Report indicated a rise in private nonfarm payrolls of 128,000 last month. The October figure from the U.S. Bureau of Labor Statistics will be published this Friday. ADP's [...]
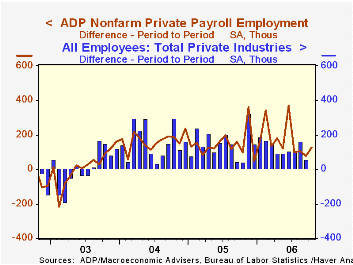
The payroll processor ADP reported that the Nat'l Employment Report indicated a rise in private nonfarm payrolls of 128,000 last month. The October figure from the U.S. Bureau of Labor Statistics will be published this Friday.
ADP's measure of private nonfarm payrolls for September indicated a weak 78,000 rise in payrolls that was accompanied by a meager 59,000 rise in private nonfarm payrolls, when published by BLS.
ADP compiled the estimate from its database of individual companies' payroll information. Macroeconomic Advisers, LLC, the St. Louis economic consulting firm, developed the methodology for transforming the raw data into an economic indicator.
According to ADP and Macro Advisers, the correlation between the monthly percentage change in the ADP estimate and that in the BLS data is 0.90.
The ADP National Employment Report data is maintained in Haver's USECON database; historical data go back to December 2000. The figures in this report cover only private sector jobs and exclude employment in the public sector, which rose an average 11,083 during the last twelve months.
The full ADP National Employment Report can be found here, and the ADP methodology is explained here.
Globalization's Effect on Interest Rates and the Yield Curve from the Federal Reserve Bank of Dallas can be found here.
| LAXEPA@USECON | October | September | Y/Y | 2005 | 2004 | 2003 |
|---|---|---|---|---|---|---|
| Nonfarm Private Payroll Employment (Chg.) | 128,000 | 78,000 | 1.9% | 1.7% | 1.3% | -0.4% |
by Tom Moeller November 1, 2006
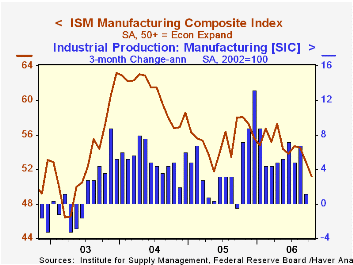
The Institute for Supply Management reported that last month's composite index of manufacturing sector activity fell to 51.2 from 52.9 during September. The decline was the fifth in the last six months and was to the lowest level since July 2003. Consensus expectations had been for stability at 53.0.
During the last ten years there has been a 67% correlation between the level of the ISM index and three month growth in factory sector industrial production.
The price index, which is not included in the composite, collapsed to 47.0. The reading was the first below 50 in over one year and reflected just 18% of respondents reporting higher prices, 58% with prices unchanged and 24% indicating lower prices.
During the last ten years there has been an 89% correlation between the level of the price index and the three month change in the PPI for intermediate goods less food & energy.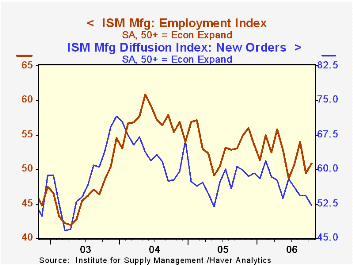
A lower new orders (52.1) and a lower production (51.9) component led the composite index down. In addition, the vendor performance measure fell to 50.2, indicating the quickest delivery speeds since July 2003. The inventories index rose to a low 49.2.
The new export orders index at 57.8 improved to its highest level January. The series peak was in early 2004 near 60. During the last ten years there has been a 69% correlation between the level of the export order index and the q/q growth in goods exports from the GDP accounts. The imports index rose slightly.
Employment also improved, marginally, to a barely break-even 50.8. During the last ten years there has been a 77% correlation between the level of the ISM employment Index and the three month growth in factory sector employment.
U.S. Maneuvers Through Choppy Waters from the Federal Reserve Bank of St. Louis is available here.
The Yield Curve as a Leading Indicator: Some Practical Issues from the Federal Reserve Bank of New York can be found here.
| ISM Manufacturing Survey | October | September | Oct. '05 | 2005 | 2004 | 2003 |
|---|---|---|---|---|---|---|
| Composite Index | 51.2 | 52.9 | 58.1 | 55.5 | 60.5 | 53.3 |
| Prices Index (NSA) | 47.0 | 61.0 | 84.0 | 66.4 | 79.8 | 59.6 |
by Tom Moeller November 1, 2006
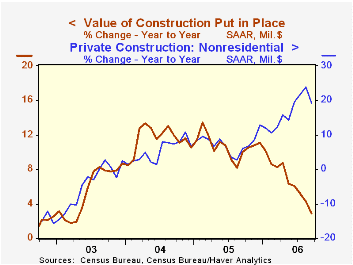
The value of construction put in place fell 0.3% during September after a slight decline the prior month which was downwardly revised. Consensus expectations had been for a 0.1% gain and it was the third decline in three months.
Residential building dropped another sharp 1.1%, the sixth decline in as many months. New single family building fell an even harder 2.5% (-12.8% y/y) however spending on improvements rose 1.0%% (2.8% y/y) and recovered after two months of little change.
During the last twenty years there has been an 84% correlation between the q/q change in the value of residential building and its contribution to growth in real GDP.
Slowdown in Housing Won’t Shut Down Economic Growth from the Federal Reserve Bank of St. Louis can be found here.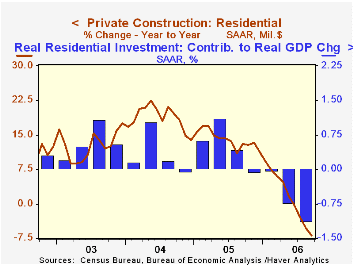
Nonresidential building inched up 0.1% after a little revised 3.1% surge during August. Lodging jumped 2.8% (61.7% y/y) and office construction tacked on another 0.8% (28.0% y/y) to earlier monthly gains which ranged between two and eight percent. Multi-retail building boomed another 2.2% (44.8% y/y) though building by the factory sector slipped 0.6% (+22.2% y/y) after a 7.9% surge the prior month.
Public construction spending rose 0.9% but a previously reported 1.1% August increase was revised to just 0.3%. The 1.7% (+13.2% y/y) monthly decline in construction activity on highways & streets, nearly one third of the value of public construction spending, was the fourth in a row.
These more detailed categories represent the Census Bureau’s reclassification of construction activity into end-use groups. Finer detail is available for many of the categories; for instance, commercial construction is shown for Automotive sales and parking facilities, drugstores, building supply stores, and both commercial warehouses and mini-storage facilities. Note that start dates vary for some seasonally adjusted line items in 2000 and 2002 and that constant-dollar data are no longer computed.
The great turn-of-the-century housing boom from the Federal Reserve Bank of Chicago is available here.
| Construction Put-in-place | September | August | Y/Y | 2005 | 2004 | 2003 |
|---|---|---|---|---|---|---|
| Total | -0.3% | -0.0% | 2.9% | 10.7% | 11.5% | 5.6% |
| Private | -0.7% | -0.1% | 0.6% | 12.0% | 14.3% | 6.4% |
| Residential | -1.1% | -1.6% | -6.9% | 13.9% | 18.6% | 12.8% |
| Nonresidential | 0.1% | 3.1% | 19.2% | 7.4% | 5.3% | -4.8% |
| Public | 0.9% | 0.3% | 11.6% | 6.2% | 2.8% | 2.9% |
by Tom Moeller November 1, 2006
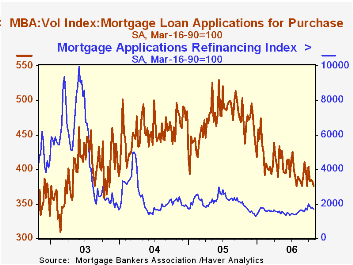
The total number of mortgage applications fell a hard 3.0% last week and pulled the average number of applications down 0.6% during October, according to the Mortgage Bankers Association. That was the first m/m decline in total applications and followed a 5.6% increase during September.
Applications to refinance skidded 4.5% after a moderate rise the prior week but rose 3.5% for the month from September..
Purchase applications also fell. The 1.8% decline was the fifth in the last seven weeks and lowered the average level of purchase apps in October 3.6% below September which rose 3.2% from August.
During the last ten years there has been a 58% correlation between the y/y change in purchase applications and the change in new plus existing single family home sales. sharp increases late last month.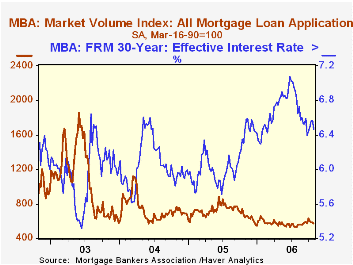
The effective interest rate on a conventional 30-year mortgage fell eleven basis points to 6.46%, the lowest level in about a month. The peak for 30 year financing was 7.08% late in June. The rate for 15-year financing also fell ten points to 6.19% versus 6.20% averaged during September and 6.24% averaged last month. The peak rate was 6.75%. Interest rates on 15 and 30 year mortgages are closely correlated (>90%) with the rate on 10 year Treasury securities.
During the last ten years there has been a (negative) 79% correlation between the level of applications for purchase and the effective interest rate on a 30-year mortgage.
The Mortgage Bankers Association surveys between 20 to 35 of the top lenders in the U.S. housing industry to derive its refinance, purchase and market indexes. The weekly survey accounts for more than 40% of all applications processed each week by mortgage lenders. Visit the Mortgage Bankers Association site here.
The latest release from the Mortgage Bankers Association indicated that 4.4% of mortgage loans were past due during the second quarter of this year, down sharply from the 4.7% past due at the end of 2005. Foreclosure had been started, however, on an increased 4.43% of loans versus 4.36% at the 2003 low.
Homeownership in a High-Cost Region from the Federal Reserve Bank of Boston is available here.
| MBA Mortgage Applications (3/16/90=100) | 10/27/06 | 10/20/06 | Y/Y | 2005 | 2004 | 2003 |
|---|---|---|---|---|---|---|
| Total Market Index | 570.8 | 588.5 | -11.7% | 708.6 | 735.1 | 1,067.9 |
| Purchase | 375.6 | 382.4 | -14.2% | 470.9 | 454.5 | 395.1 |
| Refinancing | 1,709.2 | 1,790.4 | -8.2% | 2,092.3 | 2,366.8 | 4,981.8 |
by Carol Stone November 1, 2006

Purchasing Managers surveys for a number of large countries indicate a modest slowing of manufacturing growth through October. Changes from September are not big, but most are in the same direction and the overall indexes are reinforced by moves in the key new orders component.
In China, the total index is down 0.3 point, and at 52.15, indicates growth is still spread across a good portion of reporting companies, although it is not broadening. New orders remain firm, although down fractionally from September. More notable is a slowing of outstanding orders -- backlogs -- to 49.78, just below the 50% threshold of expansion. In light of continuing growth in new orders, the decline in backlogs may only reflect strengthening productivity, but even so, it does appear that overall momentum is waning.
Russia's manufacturing sector actually appears stronger, although the latest months have diminished more than in China. Overall activity, according to the Purchasing Manager measure, had a reading last month of 53.05, down 1.65 points from September. New orders, which run consistently higher than the composite index, slipped 2.5 points to 56.82. In August both of these reached their highest levels since 1999. So the easing in September and October may only be a correction. Backlogs in Russian factories have actually strengthened since early 2005 along with the good gains in new orders. But they too corrected in October back below 50%.
The Indian economy's service sector has received more publicity in recent years, but its manufacturing industries are experiencing broad expansion as well. The overall PMI was 59.30 in October, up from September's 59.00 reading. These data are very new, beginning only in April of last year. But certainly their behavior is internally consistent. Strong new orders, evident in the graph, are pulling up backlogs, which rose 0.63 point in October to 52.68, their highest level. So momentum in Indian manufacturing looks quite vigorous.
In the long-established UK manufacturing sector, the overall index eased 0.78 point to a still firm level of 53.73, as industry there continues a year of good expansion. However, what we see in the last graph is that output is gaining as fast as new orders, so that backlogs look weak. This suggests that while overall growth is good now, it is vulnerable to any orders slowdown going forward.
| PMI Indexes, SA | Oct 2006 | Sept 2006 |
|---|---|---|
| China | 52.15 | 52.45 |
| New Orders | 53.02 | 53.39 |
| Backlogs | 49.78 | 50.56 |
| Russia | 53.05 | 54.70 |
| New Orders | 56.82 | 59.34 |
| India | 59.30 | 59.00 |
| New Orders | 66.29 | 65.17 |
| UK | 53.73 | 54.51 |
| New Orders | 54.72 | 55.00 |
| Memo: US | 51.2 | 52.9 |
| New Orders | 52.1 | 54.2 |

Tom Moeller
AuthorMore in Author Profile »Prior to joining Haver Analytics in 2000, Mr. Moeller worked as the Economist at Chancellor Capital Management from 1985 to 1999. There, he developed comprehensive economic forecasts and interpreted economic data for equity and fixed income portfolio managers. Also at Chancellor, Mr. Moeller worked as an equity analyst and was responsible for researching and rating companies in the economically sensitive automobile and housing industries for investment in Chancellor’s equity portfolio. Prior to joining Chancellor, Mr. Moeller was an Economist at Citibank from 1979 to 1984. He also analyzed pricing behavior in the metals industry for the Council on Wage and Price Stability in Washington, D.C. In 1999, Mr. Moeller received the award for most accurate forecast from the Forecasters' Club of New York. From 1990 to 1992 he was President of the New York Association for Business Economists. Mr. Moeller earned an M.B.A. in Finance from Fordham University, where he graduated in 1987. He holds a Bachelor of Arts in Economics from George Washington University.
More Economy in Brief


