Global| May 06 2009
ADP Report: Rate Of Job Loss Slowed During April
by:Tom Moeller
|in:Economy in Brief
Summary
Perhaps the labor market showed a sign of improvement during April. That could be the implication of the latest report from the payroll processor ADP in their latest National Employment Report. It indicated that private nonfarm [...]
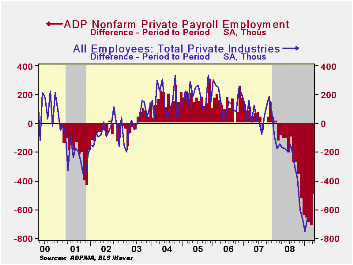
Perhaps the labor market showed a sign of improvement during April. That could be the implication of the latest report from the payroll processor ADP in their latest National Employment Report. It indicated that private nonfarm payrolls fell 491,000 last month after a 708,000 decline during March which was revised shallower from the initial estimate of a 742,000 drop. The latest reading was the fifteenth consecutive monthly decline. However, the annualized rate of decline in payrolls eased somewhat to 6.5% during the last three months.
The U.S. Bureau of Labor Statistics will report payroll employment this Friday. For comparison, March's 708,000 worker decline in ADP's measure of private nonfarm payrolls was accompanied by a 658,000 worker decline in the BLS measure of private sector payrolls. According to ADP and Macro Advisers, the correlation between the monthly percentage change in the ADP estimate and that in the BLS data is 0.90.ADP reported that
last month medium sized payrolls fell 231,000 (-4.9% y/y) followed by a 183,000 (-3.6% y/y) worker decline in small sized payrolls. Large payrolls fell by 77,000 (-4.9% y/y). In the goods producing sector there were 262,000 fewer jobs in April (-11.0% y/y). Medium-sized payrolls fell 125,000 (-11.5% y/y) followed by a 91,000 (-10.2% y/y) shortfall in small-sized payrolls. Large payrolls fell 46,000 (-11.2% y/y). In the manufacturing sector alone, payrolls fell 159,000 (-10.9% y/y). It has fallen in almost every month since 2001.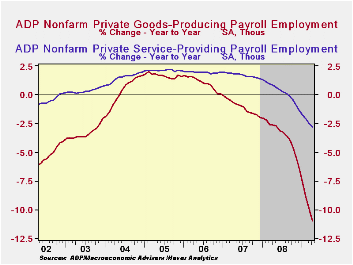
Employment in the service producing industry continued to fall sharply during April. The 229,000 (-2.8% y/y) decline was the thirteenth consecutive monthly decline. Medium-sized service payrolls fell 106,000 (-3.1% y/y) and small-sized payrolls were off 92,000 (-2.4% y/y). Large service producing payrolls dropped by 31,000 (-3.0% y/y).
ADP compiled the estimate from its database of individual companies' payroll information. Macroeconomic Advisers, LLC, the St. Louis economic consulting firm, developed the methodology for transforming the raw data into an economic indicator.
The ADP National Employment Report data is maintained in Haver's
USECON database; historical figures date back to December 2000. The figures in this report cover only private sector jobs and exclude employment in the public sector, which rose an average 11,083 during the last twelve months.The full ADP National Employment Report can be found here
, and the ADP methodology is explained here.| LAXEPA@USECON | April | March | Y/Y | 2008 | 2007 | 2006 |
|---|---|---|---|---|---|---|
| Nonfarm Private Payroll Employment (m/m Chg.) | -491,000 | -708,000 | -4.3% | -0.4 | 1.2% | 2.0% |
by Tom Moeller May 6, 2009
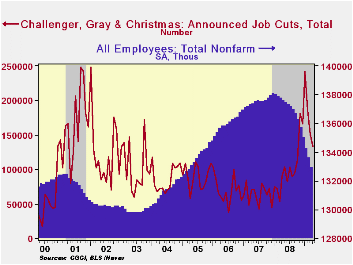
For April, the outplacement firm of Challenger, Grey & Christmas indicated that cut announcements eased for the third month. The announcement of 132,590 layoffs followed 150,411 during March and both of the figures were down from the cycle high of 241,749 reached in January. Challenger also reported that announced hiring plans rose to the highest level since early-2007.
Announcement of job cuts in the pharmaceutical industry dropped sharply to 1,671 after their record March surge. Announcements in the electronics industry also halved their March jump and in the retail industry job cuts showed the third month of moderation and the number of jobs fell to a modest 2,927. Finally, the computer industry shed just 1,702 jobs which was the least since August of last year and cuts in the financial business fell to 6,645.
Picking up some steam were job cut announcements in the automotive sector which rose to 24,172 after easing during March. Also there was a pickup in layoffs in the industrial goods sector where there were 18,636 announcements. Employment cutbacks in the insurance industry also rose as there were 1,330 which was up sharply from the prior two months.
During the last ten years there has been a 67% (inverse) correlation between the three month moving average of announced job cuts and the three month change payroll employment.
Job cut announcements differ from layoffs. Many are achieved through attrition, early retirement or just never occur.
The Challenger figures are available in Haver's SURVEYS database.
| Challenger, Gray & Christmas | April | March | Y/Y | 2008 | 2007 | 2006 |
|---|---|---|---|---|---|---|
| Announced Job Cuts | 132,590 | 150,411 | 47.3% | 1,223,993 | 768,264 | 839,822 |
by Tom Moeller May 6, 2009
Following earlier sharp declines, the Mortgage Bankers
Association reported that mortgage applications stabilized last week
near the prior week's level. Overall, applications inched up 2.0% after
the 18.1% decline during late April. Nevertheless, applications
remained down by nearly one-quarter from their early-April peak.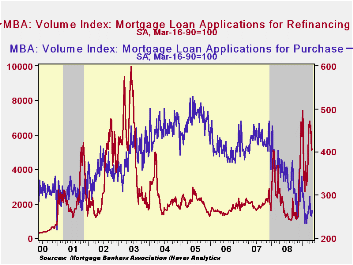
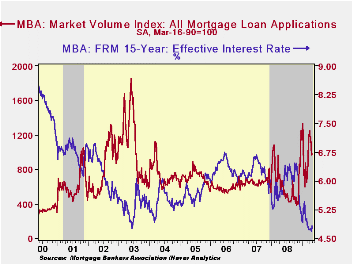
Last week's improvement owed to a 5.0% w/w rise in mortgage applications to purchase a home. They rose to the highest level in four weeks. Nevertheless, these applications are down by nearly one-third from the year ago level, a decline which is greater than the y/y decline in new plus existing home sales of 9.3% through March.
The index of applications to refinance a home mortgage inched up just 1.2% following the prior week's 21.9% drop. Despite the w/w volatility, applications are still more than double the year-ago level.
The earlier decline in interest rates showed signs of stabilizing. The effective interest rate on a conventional 15-year mortgage rose last week to 4.83% which was the highest level since mid-March. For a 30-year mortgage rates also rose to 5.02%. Interest rates on 15- and 30-year mortgages are closely correlated (>90%) with the rate on 10-year Treasury securities. Finally, for an adjustable 1-Year mortgage the rate rose to 6.39%, its highest level this year but the rate still was down sharply from the 7.07% peak reached this past Fall.
During the last ten years there has been a (negative) 79% correlation between the level of applications for purchase and the effective interest rate on a 30-year mortgage. Moreover, during the last ten years there has been a 61% correlation between the y/y change in purchase applications and the change in new plus existing single family home sales.
The figures for weekly mortgage applications are available in Haver's SURVEYW database.
The Mortgage Bankers Association surveys between 20 to 35 of the top lenders in the U.S. housing industry to derive its refinance, purchase and market indexes. The weekly survey covers roughly 50% of all U.S. residential mortgage applications processed each week by mortgage banks, commercial banks and thrifts. Visit the Mortgage Bankers Association site here.
| MBA Mortgage Applications (3/16/90=100) | 05/01/09 | 04/24/09 | Y/Y | 2008 | 2007 | 2006 |
|---|---|---|---|---|---|---|
| Total Market Index | 979.7 | 960.6 | 49.5% | 642.9 | 652.6 | 584.2 |
| Purchase | 264.3 | 251.6 | -30.7% | 345.4 | 424.9 | 406.9 |
| Refinancing | 5,169.3 | 5,108.2 | 127.3% | 2,394.1 | 1,997.9 | 1,634.0 |
by Robert Brusca May 6, 2009
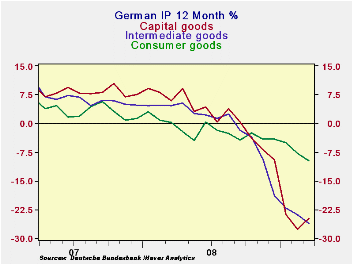
German industrial production halted its string of six
consecutive declines with a flat result in March. Over three months the
negative growth rate for IP has flattened but at a still horrific -33%
(saar). Ironically, the capital goods sector shows the worst results
and fasted decline in its three month rate of growth compared to other
sectors. Yet the capital goods sector is the only sector with an output
increase in March – and a strong one at that.
Construction is in its second month of increasing output.
However, manufacturing output fell in March, but it did trim that drop
to -0.2% from -3.5% previously. And of course the flat IP result fits
in nicely with the surge in German orders in March. The process of
blunting the forces of the downturn and establishing an environment of
growth is now fully engaged in Germany, Europe’s largest economy.
Coupled with the fresh ECB rate cut and the ECB’s decision on to engage
in covered bond purchases, Europe has some new reason for hope.
| |
|||||||
|---|---|---|---|---|---|---|---|
| Saar exept m/m | Mar-09 | Feb-09 | Jan-09 | 3-mo | 6-mo | 12-mo | Quarter-to-Date |
| IP total | 0.0% | -3.4% | -6.3% | -32.7% | -33.1% | -20.3% | -40.1% |
| Consumer | -2.0% | -3.7% | -0.6% | -22.7% | -14.6% | -9.8% | -13.9% |
| Capital | 2.5% | -5.2% | -13.5% | -50.1% | -41.5% | -24.7% | -55.8% |
| Intermed | -2.4% | -1.3% | -4.0% | -27.0% | -40.4% | -26.2% | -43.9% |
| Memo | |||||||
| Construction | 7.6% | 1.9% | -7.5% | 5.5% | 14.6% | 4.9% | -0.6% |
| MFG IP | -0.2% | -3.5% | -7.7% | -37.8% | -37.1% | -22.9% | -45.7% |
| MFG Orders | 3.3% | -3.1% | -6.7% | -23.9% | -43.3% | -33.1% | -46.5% |
by Robert Brusca May 6, 2009
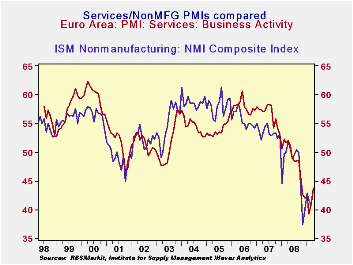
April’s jump is the second largest increase in Markit’s e-Area
Services PMI index since late 2000. The April surge brings the index up
to 43.76 still well below a neutral reading of 50 but that still leaves
the index relatively low in its historic range in the 21st percentile.
Over the same period, however, the EU Commission’s EMU service sector
index stands at the 8th percentile in its range, a relatively weaker
reading. If we assess the Markit reading on a queuing basis, by ranking
the index reading and telling where the current percentile of the
ranked readings stands, we find it is in the bottom 5% of all readings.
That is more similar to the dismal EU Commission’s assessment. Anyway
you slice it the index it is showing improvement but the current
assessment is still poor.
The month’s move is strongly in the right direction and the
improvement is cast wide across reporting EMU countries. It also fits
nicely with the pattern of improvement reported by the Markit MFG
indices. The current ISM reading ranks 97th out of the last 102
readings. Most EMU countries are at about that some relative position.
Ireland is worse off, posting the second worst reading in the last 102
observations. Over this same period the US ISM for nonMFG, the closest
comparison we have to the EMU reading, also ranks 97th out of the same
102 observations. The US and EMU ‘services’ sectors are roughly in the
same cyclical position.
In terms of the levels of the readings the US is now a hair
behind the level posted in EMU and behind it as a percentage of the
mean as well. So EMU services have rebounded quite sharply but in
comparisons with the US, the US rebound was sharper. The main reason
that the US is better off in percentile terms is that it had carved out
a lower low in this cycle than did EMU services. So its standing in its
range is better relative to its lower low. Both service sectors are now
on about the same path for recovery.
| Markit Services Indices for EU/EMU | |||||||
|---|---|---|---|---|---|---|---|
| Apr-09 | Mar-09 | Feb-09 | 3Mo | 6Mo | 12Mo | Percentile | |
| Euro-13 | 43.76 | 40.95 | 39.24 | 41.32 | 41.77 | 45.11 | 21.1% |
| Germany | 43.76 | 42.30 | 41.32 | 42.46 | 44.05 | 47.77 | 12.4% |
| France | 46.52 | 43.64 | 40.18 | 43.45 | 43.27 | 46.12 | 25.9% |
| Italy | 42.05 | 39.10 | 37.85 | 39.67 | 39.98 | 43.80 | 17.5% |
| Spain | 42.30 | 34.11 | 31.73 | 36.05 | 33.39 | 35.39 | 43.7% |
| Ireland | 32.16 | 35.69 | 31.78 | 33.21 | 33.39 | 37.02 | 1.1% |
| EU only | |||||||
| UK (CIPs) | 48.68 | 45.47 | 43.24 | 45.80 | 43.36 | 45.17 | 42.0% |
| US NONFMG ISM | 43.70 | 40.80 | 41.60 | 42.03 | 41.08 | 45.09 | 26.3% |
| EU Commission Indices for EU and EMU | |||||||
| EU Index | Apr-09 | Mar-09 | Feb-09 | 3Mo | 6Mo | 12Mo | Percentile |
| EU Services | -30 | -31 | -29 | -32.67 | -30.67 | -24.83 | 8.3% |
| EMU | Apr-09 | Mar-09 | Feb-09 | 3Mo | 6Mo | 12Mo | Percentile |
| Services | -24 | -25 | -24 | -24.33 | -20.67 | -11.42 | 1.9% |
| Cons Confidence | -31 | -34 | -33 | -32.67 | -30.67 | -15.89 | 8.3% |
| Consumer confidence by country | |||||||
| Germany-Ccon | -34 | -31 | -29 | -31.33 | -26.33 | -16.92 | 0.0% |
| France-Ccon | -32 | -36 | -36 | -34.67 | -33.67 | -28.75 | 10.0% |
| Ital-Ccon | -25 | -31 | -28 | -28.00 | -27.67 | -25.25 | 18.2% |
| Spain-Ccon | -39 | -43 | -48 | -43.33 | -44.00 | -41.00 | 18.8% |
| UK-Ccon | -22 | -28 | -32 | -27.33 | -28.83 | -25.67 | 34.2% |
| percentile is over range since May 2000 | |||||||
by Louise Curley May 6, 2009
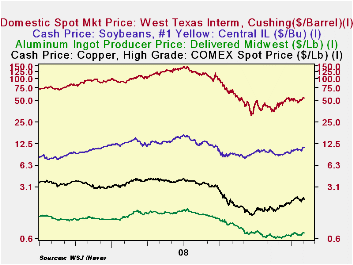
Among the signs that the global downturn may be bottoming are
recent increases in some commodity prices. The Commodity Research
Bureau Index of Spot Prices is up 11.2% from its recent low of 305.59
(1967=100) reached on March 18, as shown in the first chart. Even the
price of oil has recently begun to rise as can be seen in the second
chart that shows the daily prices of such specific commodities as
aluminum, copper, soybeans and oil.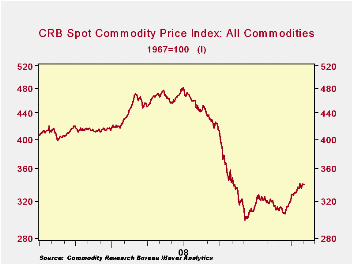
As a result of the rise in prices, commodity producing countries are experiencing increased demand for their for their currencies. Many of these countries have seen substantial appreciation of the currencies within the past two months or so. Since March 6th for example, the South African Rand has appreciated 23.4%. Other commodity producing countries, such as Brazil, Australia and Indonesia have seen their currencies appreciate by 9.2%, 12.2%, and 13.3% respectively. Japan and the Euro Area are much less dependent on commodities than say, Indonesia, and therefore the rise in commodity prices has had little effect on their exchange rates.The yen actually depreciated slightly in this period and the Euro appreciated 4.9%.
Reflecting these and other exchange rate changes, the U.S. Dollar has depreciated about 5.1% over the past two months according to the J.P. Morgan Effective Nominal Trade Weighted Exchange Rate.
| (EXCHANGE RATES | Wk Ending May 1st | Wk Ending Mar 6th | Appreciation /Depreciation | |
|---|---|---|---|---|
| Brazil | Real/USD | 2.3735 | 2.1730 | 9.2% |
| Australia | USD/A$ | .6381 | .7162 | 12.24 |
| South Africa | Rand/USD | 10.4100 | 23.41 | |
| Indonesia | Rupiah/USD | 11990 | 10585 | 13.27 |
| South Korea | Won/USD | 1554.8 | 1345.4 | 15.56 |
| Japan | Yen/USD | 98.15 | 99.10 | -0.96 |
| Euro | USD/Euro | 1.2658 | 1.3275 | 4.87 |
| USD | Broad Trade Wtd | 98.5 | 93.4 | -5.08 |

Tom Moeller
AuthorMore in Author Profile »Prior to joining Haver Analytics in 2000, Mr. Moeller worked as the Economist at Chancellor Capital Management from 1985 to 1999. There, he developed comprehensive economic forecasts and interpreted economic data for equity and fixed income portfolio managers. Also at Chancellor, Mr. Moeller worked as an equity analyst and was responsible for researching and rating companies in the economically sensitive automobile and housing industries for investment in Chancellor’s equity portfolio. Prior to joining Chancellor, Mr. Moeller was an Economist at Citibank from 1979 to 1984. He also analyzed pricing behavior in the metals industry for the Council on Wage and Price Stability in Washington, D.C. In 1999, Mr. Moeller received the award for most accurate forecast from the Forecasters' Club of New York. From 1990 to 1992 he was President of the New York Association for Business Economists. Mr. Moeller earned an M.B.A. in Finance from Fordham University, where he graduated in 1987. He holds a Bachelor of Arts in Economics from George Washington University.
More Economy in Brief