 Global| Jan 03 2008
ADP Report: Private Payroll Growth Negligible
by:Tom Moeller
|in:Economy in Brief
Summary
The ADP National Employment Report, reported by the payroll processor, indicated that private nonfarm payroll growth deteriorated to 40,000 during December after a downwardly revised 173,000 November rise.The increase was the weakest [...]
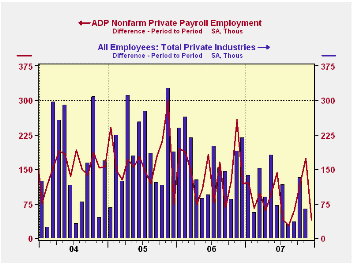
The ADP National Employment Report data is maintained in Haver's USECON database; historical data go back to December 2000. The figures in this report cover only private sector jobs and exclude employment in the public sector, which rose an average 11,083 during the last twelve months.
The full ADP National Employment Report can be found here, and the ADP methodology is explained here.
| LAXEPA@USECON | December | November | Y/Y | 2006 | 2005 | 2004 |
|---|---|---|---|---|---|---|
| Nonfarm Private Payroll Employment (m/m Chg.) | 40,000 | 173,000 | 0.9% | 1.7% | 1.8% | 1.3% |
by Tom Moeller January 3, 2008
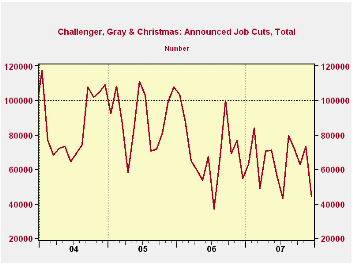
Challenger, Grey & Christmas reported that job cut announcements in December fell back to 44,416 after 73,140 during November. The number of announcements was the lowest since the middle of last year.
Job cut announcements fell sharply m/m in the auto industry (+6.7% y/y), electronics (-65.5%) and the construction industries but rose sharply in the retail (89.7% y/y) industry.
During the last ten years there has been a 79% (inverse) correlation between the three month moving average of announced job cuts and the three month change payroll employment.
Job cut announcements differ from layoffs. Many are achieved through attrition, early retirement or just never occur.
Challenger also reported that announced hiring plans were roughly stable with the prior three months.
| Challenger, Gray & Christmas | December | November | Y/Y | 2006 | 2005 | 2004 |
|---|---|---|---|---|---|---|
| Announced Job Cuts | 44,416 | 73,140 | -18.7% | 839,822 | 1,072,054 | 1,039,935 |
by Tom Moeller January 3, 2008
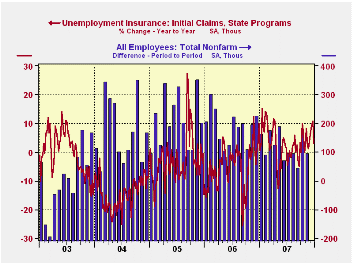
Initial claims for jobless insurance fell 21,000 last week to 336,000 after a 9,000 rise during the prior week. During the week prior claims had risen a sharp 14,000, so the latest figure reversed nearly all of those two increases.
The four week moving average of initial claims, a measure which smoothes out most of the series' w/w volatility, fell slightly to 343,750 (7.5% y/y) and backpedaled from the highest level since 2005.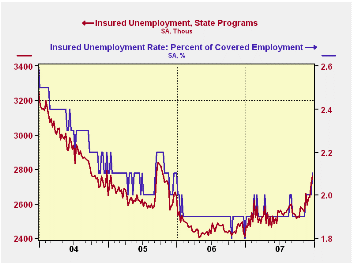
A claims level below 400,000 typically has been associated with growth in nonfarm payrolls. During the last six years there has been a (negative) 78% correlation between the level of initial claims and the m/m change in nonfarm payroll employment.
Continuing claims for unemployment insurance surged 46,000 after a 77,000 jump during the prior week. The gain lifted continuing claims to the highest level since 2005.
The continuing claims numbers lag the initial claims figures by one week.
The insured rate of unemployment rose to 2.1% after five weeks at 2.0%. the latest was the highest since 2005.
What Do Worker Flows Tell Us About Cyclical Fluctuations in Employment? from the Federal Reserve Bank of Philadelphia is available here.
| Unemployment Insurance (000s) | 12/29/07 | 12/22/07 | Y/Y | 2006 | 2005 | 2004 |
|---|---|---|---|---|---|---|
| Initial Claims | 336 | 357 | 3.1% | 313 | 331 | 343 |
| Continuing Claims | -- | 2,761 | 13.8% | 2,459 | 2,662 | 2,924 |

Tom Moeller
AuthorMore in Author Profile »Prior to joining Haver Analytics in 2000, Mr. Moeller worked as the Economist at Chancellor Capital Management from 1985 to 1999. There, he developed comprehensive economic forecasts and interpreted economic data for equity and fixed income portfolio managers. Also at Chancellor, Mr. Moeller worked as an equity analyst and was responsible for researching and rating companies in the economically sensitive automobile and housing industries for investment in Chancellor’s equity portfolio. Prior to joining Chancellor, Mr. Moeller was an Economist at Citibank from 1979 to 1984. He also analyzed pricing behavior in the metals industry for the Council on Wage and Price Stability in Washington, D.C. In 1999, Mr. Moeller received the award for most accurate forecast from the Forecasters' Club of New York. From 1990 to 1992 he was President of the New York Association for Business Economists. Mr. Moeller earned an M.B.A. in Finance from Fordham University, where he graduated in 1987. He holds a Bachelor of Arts in Economics from George Washington University.
More Economy in Brief


