 Global| Apr 01 2009
ADP Report: Payroll Employment Down Another 742,000
by:Tom Moeller
|in:Economy in Brief
Summary
According to the payroll processor ADP in the latest National Employment Report, private nonfarm payrolls fell 742,000 last month after a 706,000 decline. The February figure was revised from the initial estimate of a 697,000 drop. [...]
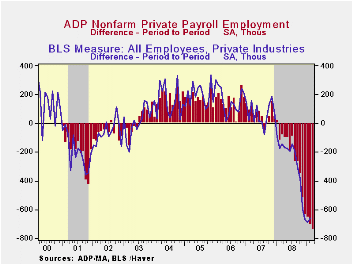
According to the payroll processor ADP in the latest National Employment Report, private nonfarm payrolls fell 742,000 last month after a 706,000 decline. The February figure was revised from the initial estimate of a 697,000 drop. The latest reading was the fourteenth consecutive monthly decline. Moreover, the annualized rate of decline in payrolls accelerated to 7.2% during the last three months, a record for the series which dates back only to 2001. Last month medium sized payrolls fell 330,000 (-4.5% y/y) followed by a 284,000 (-3.3% y/y) worker decline in small sized payrolls. Large payrolls fell by 128,000 (-4.7% y/y).
The U.S. Bureau of Labor Statistics will report payroll employment this Friday. For comparison, February's 706,000 worker decline (-3.4% y/y) in ADP's measure of private nonfarm payrolls was accompanied by a 660,000 worker decline (-3.7% y/y) in the BLS measure of private sector payrolls. According to ADP and Macro Advisers, the correlation between the monthly percentage change in the ADP estimate and that in the BLS data is 0.90.ADP reported that weakness in the goods producing sector resulted in 327,000 fewer jobs last month (-10.1% y/y). Medium sized payrolls fell 152,000 (-10.5% y/y) followed by a 111,000 (-9.3% y/y) shortfall in small sized payrolls. Large payrolls fell 64,000 (-10.5% y/y). In the manufacturing sector alone, payrolls fell 206,000 (-10.1% y/y). It has fallen in almost every month since 2001.
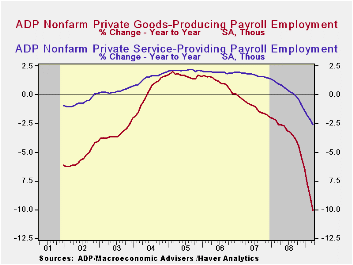
Employment in the service producing industry continued to fall sharply. The 415,000 (-2.6% y/y) decline was the twelfth consecutive monthly decline. Medium sized service payrolls fell 178,000 (-2.9% y/y) and small sized payrolls were off 173,000 (-2.2% y/y). Large service producing payrolls dropped by 64,000 (-3.0% y/y).
ADP compiled the estimate from its database of individual companies' payroll information. Macroeconomic Advisers, LLC, the St. Louis economic consulting firm, developed the methodology for transforming the raw data into an economic indicator.
The ADP National Employment Report data is maintained in Haver's
USECON database; historical figures date back to December 2000. The figures in this report cover only private sector jobs and exclude employment in the public sector, which rose an average 11,083 during the last twelve months.The full ADP National Employment Report can be found here, and the ADP methodology is explained here.
| LAXEPA@USECON | March | February | Y/Y | 2008 | 2007 | 2006 |
|---|---|---|---|---|---|---|
| Nonfarm Private Payroll Employment (m/m Chg.) | -742,000 | -706,000 | -4.0% | -0.4 | 1.2% | 2.0% |
by Tom Moeller April 1, 2009
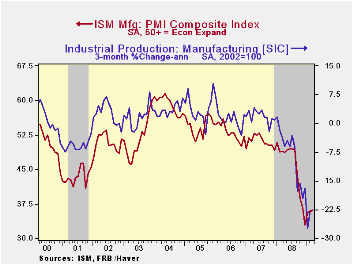
The March composite index of activity in the manufacturing sector from the Institute for Supply Management improved slightly to 36.3 from 35.8 in February. Though the latest figure was still near the lowest level since the recession year of 1980, the index has remained in a range of 33 to 37 during the last five months. The break-even level for this diffusion index of factory sector activity is a level of 50.
During the last twenty years there has been a 72% correlation between the level of the composite index and the three-month growth in factory sector industrial production. The latest reading of the composite index suggests that the recent 10% rate of decline in industrial output will continue.
It is appropriate to correlate the ISM index level
with factory sector growth because
the ISM index is a diffusion index. It measures growth by using all of
the positive changes in activity added to one half of the zero change
in activity measures.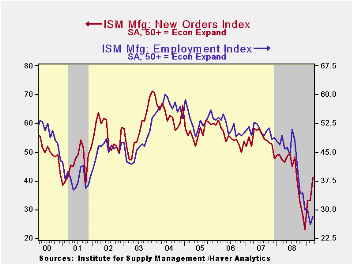
Improvement in the new orders index has been sharp since its December low as 28% of survey participants reported higher orders versus a low of 5%. Even the export order index improved modestly to a still low 39.0 versus the December reading of 35.5. Nevertheless, it remained near the lowest level in this index's short twenty year history. During the last ten years there has been a 53% correlation between the index and the q/q change in real exports of goods in the GDP accounts.
The production component was about unchanged after sharp improvement in January and February. Offsetting these gains were sharp declines in the vendor deliveries index to the lowest level since 1989. The inventory index was weak and fell to the lowest level since 1982.
The separate index of prices paid improved slightly but it remained near the record low. During the last twenty years there has been a 79% correlation between the price index and the three-month change in the PPI for intermediate goods.
The ISM data is available in Haver's USECON database.
How Will a Credit Crunch Affect Small Business Finance? from the Federal Reserve Bank of San Francisco is available here
| ISM Mfg | March | February | March '08 | 2008 | 2007 | 2006 |
|---|---|---|---|---|---|---|
| Composite Index | 36.3 | 35.8 | 49.0 | 45.5 | 51.1 | 53.1 |
| New Orders Index | 41.2 | 33.1 | 47.1 | 42.1 | 54.3 | 55.4 |
| Employment Index | 28.1 | 26.1 | 49.3 | 43.2 | 50.5 | 51.7 |
| Prices Paid Index (NSA) | 31.0 | 29.0 | 83.5 | 66.5 | 64.6 | 65.0 |
by Tom Moeller April 1, 2009
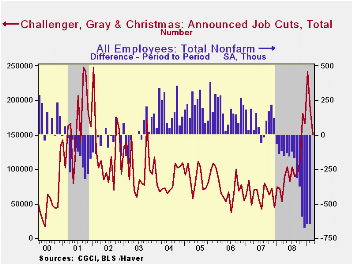
The outplacement firm of Challenger, Grey & Christmas reported that March job cut announcements eased for the second month to 150,411 following 186,350 layoffs during February. Both of the figures were down from the cycle high of 241,749 reached in January. Challenger also reported that announced hiring plans picked up somewhat from February.
Announcements of job cuts in the pharmaceutical industry were a strong 17,796 which was the second most on record. Announcements in the electronics industry also were strong. Another 11,550 jobs were shed and that was near the rate of decline during the prior three months.
Job cut announcements in the automotive sector eased sharply to 6,806 after a huge jump during February and the financial business shed 8,651 jobs. Employment in the retail industry fell 3,821 after the 18,759 February cut. Employment in the industrial goods industry also fell a more moderate 8,787. The computer industry shed 5,290 after the 3,960 February cutback.
During the last ten years there has been a 67% (inverse) correlation between the three month moving average of announced job cuts and the three month change payroll employment.
Job cut announcements differ from layoffs. Many are achieved through attrition, early retirement or just never occur.
The Challenger figures are available in Haver's SURVEYS database.
| Challenger, Gray & Christmas | March | February | Y/Y | 2008 | 2007 | 2006 |
|---|---|---|---|---|---|---|
| Announced Job Cuts | 150,411 | 186,350 | 180.7% | 1,223,993 | 768,264 | 839,822 |
by Tom Moeller April 1, 2009
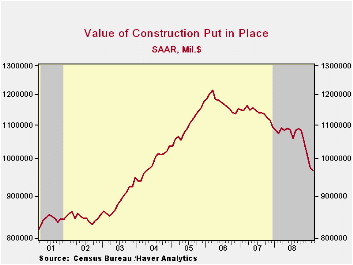
Perhaps the worst news on construction activity has passed. However, the industry detail suggests not to count on it. The value of construction put-in-place slipped just 0.9% during February following three consecutive months of decline in excess of 3%. Consensus expectations had been for a 1.7% drop.
A 0.3% increase in the value of nonresidential building activity was the source of the February surprise. It followed three consecutive months of decline between 1% and 4% which reflected the lagged effects of economic recession and the collapse of corporate profits. Those forces are ongoing. February increases in the lodging, health care, amusement and transportation sectors accounted for most of the overall increase in activity, but the gains made up at best half of the January declines. Spending on office construction was roughly flat after four months of sharp decline while the food/beverage, multi-retail, commercial, power and highways & streets sectors continued down.
Residential building activity continued its downward march
with a
4.3% decline after the similar 3.7% January drop. Single-family
construction activity fell another 10.9% and remained off by nearly one
half year-to-year. Building activity on multi-family units also was
weak (-11.2% y/y) though spending on improvements repeated the January
gain and rose 1.9% (-6.9% y/y).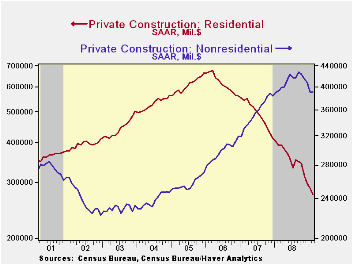
During the last twenty years there has been an 84% correlation between the q/q change in the value of residential building and its contribution to growth in real GDP.
Public construction edged up just 0.8% after two months of sharp decline. Again, the recession's effect on tax revenues may be taking hold. The level of activity for January and February was 1.8% below 2008. The value of spending on transportation facilities edged up just 0.8% (-4.7% y/y) after three months of sharp decline. Spending on highways & streets also fell for the third straight month (+3.0% y/y). The value of construction on highways & streets is roughly one-third of the value of total public construction spending.
The more detailed categories of construction represent the Census Bureau’s reclassification of construction activity into end-use groups. Finer detail is available for many of the categories; for instance, commercial construction is shown for automotive sales and parking facilities, drugstores, building supply stores, and both commercial warehouses and mini-storage facilities. Note that start dates vary for some seasonally adjusted line items in 2000 and 2002, and that constant-dollar data are no longer computed.
The construction put-in-place figures are available in Haver's USECON database.
| Construction (%) | February | January | Y/Y | 2008 | 2007 | 2006 |
|---|---|---|---|---|---|---|
| Total | -0.9 | -3.5 | -10.0 | -5.7 | -2.7 | 6.3 |
| Private | -1.6 | -4.0 | -15.0 | -9.8 | -6.9 | 5.5 |
| Residential | -4.3 | -3.7 | -29.8 | -27.7 | -19.8 | 1.0 |
| Nonresidential | 0.3 | -4.3 | -0.2 | 14.9 | 19.6 | 16.2 |
| Public | 0.8 | -2.4 | 3.4 | 6.7 | 12.3 | 9.3 |
by Tom Moeller April 1, 2009
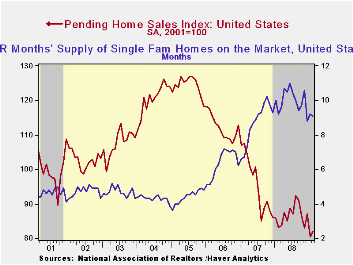
The National Association of Realtors indicated that pending sales of existing homes during February edged up 2.1% after the sharp 7.7% decline during January. The decline left sales so far this year 6.4% below the 2008 average after last year's 9.5% decline. Consensus expectations had been for a 0.5% February slip.
The home sales figures are analogous to the new home sales
data from
the Commerce Department in that they measure existing home sales when
the sales contract is signed, not at the time the sale is closed. The
series dates back to 2001.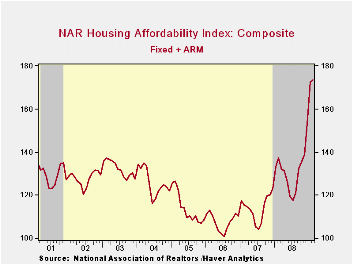
Lower prices continued to bolster home sales. The median sales price of an existing home rose in February (-15.5% y/y) after seven straight months of decline. Prices were down by one quarter from their peak during June 2007. Lower prices combined with lower interest rates to significantly raise the affordability index of a home by 26.5% year-to-year and by three quarters from the 2006 low. The latest level was a record high for the series which extends back to 1970.
Weak home sales are encouraging potential sellers to keep their homes off the market. The Realtors Association indicated in an earlier report that the number of homes on the market and available for sale fell by 5.5% during February versus one year earlier.
At the current sales rate there was a 9.7 months' supply of homes on the market and there was a 10.4 months' supply during all of last year, up from the 8.9 months supply during 2007 and 6.5 months during 2006. For single family homes, there was a 9.1 months' supply in February versus a full-year figure of 10.0 months during 2008.
The pending home sales data are available in Haver's PREALTOR database. The number of homes on the market and prices are in the REALTOR database.
| Pending Home Sales (2001=100) | February | January | Y/Y | 2008 | 2007 | 2006 |
|---|---|---|---|---|---|---|
| Total | 82.1 | 80.4 | -1.4% | 86.8 | 95.8 | 112.1 |
| Northeast | 63.9 | 57.8 | -11.3 | 72.6 | 85.6 | 98.5 |
| Midwest | 83.1 | 72.6 | 3.4 | 80.6 | 89.5 | 102.0 |
| South | 85.8 | 82.2 | -0.1 | 89.8 | 107.3 | 127.3 |
| West | 89.6 | 103.6 | -1.8 | 99.3 | 92.1 | 109.5 |
by Robert Brusca April 1, 2009
With the advent of Japan’s Tankan report, the US-UK Japan
point of
view will line up on the side of more stimulus. It is not clear that
they have enough support to carry the day, however. Germany is still
opposed to more stimulus now and that position has been stated again
today. Both France and Germany want progress on regulation. Each has
said it wants real progress and agreement on a series of key
principles. So it’s not clear how these very different priorities will
play out at the summit. Where the US president says unity is the most
important theme, claiming that differences among G-20 members have been
exaggerated by the press. Wow, no wonder so many newspapers are failing.
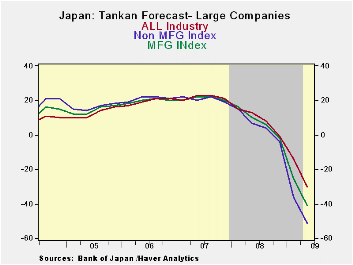
Japan’s Tankan is a worst-ever reading for large corporate
participants in the survey. Each of the survey categories across
various industries points to full period lows. Personal services at
large enterprises are an exception but not much of one.
The MFG reading fell to -58 in Q1-2009 from -24 in Q4-2008.
Non MFG fell to -31 in Q1 from -9 in 2008-Q4.
The MFG outlook index for large firms has dropped to -51 in
2009-Q1
from -36 in 2008-Q4. For non MFG firms the drop in the outlook is to
-30 in Q1 from -14 in 2008-Q4. These are deeply negative numbers and
represent sharp deteriorations from already weak readings in Q4.
Medium and small companies have a similar unraveling in
progress.
Japan has seen its domestic auto production fall sharply as
its
exports have been hammered. The exports are lower by over 50% Yr/Yr.
Export markets have generally dried up as recession forces hit hard on
the cusp of the third to fourth quarter last year. Japan is caught as
its main exports are to the US, a very weak economy, and to China where
some growth remains in train but where its exports, too are being
clobbered. As of January US imports from Japan are down by 30% Yr/Yr.
Japan is burdened by a large outstanding balance of public debt and as
a rising yen value has crimped its competitiveness in a fading market.
| Tankan Results Large Enterprises | |||||||
|---|---|---|---|---|---|---|---|
| Readings | Averages | PERCENTILES | |||||
| Q1-09 | Q4-08 | Q3-08 | Q2-08 | 1-Y Avg | Since Q3'03 | Since Q1'04 | |
| MFG | -58.0 | -24.0 | -3.0 | 5.0 | -41.0 | 12.1 | 0.0% |
| NonMFG | -31.0 | -9.0 | 1.0 | 10.0 | -20.0 | 11.7 | 0.0% |
| Total Industry | -45.0 | -16.0 | 0.0 | 7.0 | -30.5 | 11.9 | 0.0% |
| Construction | -27.0 | -10.0 | -7.0 | -1.0 | -18.5 | -4.5 | 0.0% |
| Real Estate | -21.0 | -7.0 | 5.0 | 22.0 | -14.0 | 27.7 | 0.0% |
| Wholesale | -44.0 | -7.0 | 11.0 | 12.0 | -25.5 | 14.1 | 0.0% |
| Retail | -42.0 | -18.0 | -5.0 | 0.0 | -30.0 | 2.5 | 0.0% |
| Transportation | -46.0 | -7.0 | 6.0 | 16.0 | -26.5 | 10.9 | 0.0% |
| Services 4 Biz | -21.0 | -1.0 | 4.0 | 20.0 | -11.0 | 20.0 | 0.0% |
| Personal Serv | -9.0 | -11.0 | 6.0 | 10.0 | -10.0 | 8.7 | 6.7% |
| Restaurants & Hotels | -45.0 | -32.0 | -13.0 | -14.0 | -38.5 | 1.9 | 0.0% |
| Forecast | |||||||
| Q2-09 | Q1-09 | Q4-08 | Q3-08 | 1-Y Avg | Since Q3'03 | Since Q1'04 | |
| MFG-OtLk | -51.0 | -36.0 | -4.0 | 4.0 | -21.8 | 10.4 | 0.0% |
| NonMFG -Otlk | -30.0 | -14.0 | -1.0 | 8.0 | -9.3 | 11.4 | 0.0% |
| All Industry-Otlk | -41.0 | -25.0 | -2.0 | 6.0 | -15.5 | 10.8 | 0.0% |
| Tankan Results Medium Enterprises | |||||||
| Q1-09 | Q4-08 | Q3-08 | 1-Y Avg | 1-Y Avg | Since Q3'03 | Since Q1'04 | |
| MFG | -57.0 | -24.0 | -8.0 | -22.8 | -22.8 | 1.5 | 0.0% |
| NonMFG | -37.0 | -21.0 | -12.0 | -18.8 | -18.8 | -3.3 | 0.0% |
| Forecast | |||||||
| Q2-09 | Q1-09 | Q4-08 | Q3-08 | 1-Y Avg | Since Q3'03 | Since Q1'04 | |
| MFG-OtLk | -61.0 | -45.0 | -12.0 | -5.0 | -30.8 | -2.0 | 0.0% |
| NonMFG -Otlk | -45.0 | -32.0 | -17.0 | -10.0 | -26.0 | -5.6 | 0.0% |
| All Industry-Otlk | -51.0 | -38.0 | -15.0 | -9.0 | -28.3 | -4.1 | 0.0% |
| Tankan Results Small Enterprises | |||||||
| Q2-09 | Q1-09 | Q4-08 | Q3-08 | 1-Y Avg | Since Q3'03 | Since Q1'04 | |
| MFG | -57.0 | -29.0 | -17.0 | -43.0 | -43.0 | -5.5 | 0.0% |
| Non- MFG | -42.0 | -29.0 | -24.0 | -35.5 | -35.5 | -14.9 | 0.0% |
| Total Industry | -42.0 | -29.0 | -24.0 | -35.5 | -35.5 | -14.9 | 0.0% |
| Forecast | |||||||
| Q2-09 | Q1-09 | Q4-08 | Q3-08 | 1-Y Avg | Since Q3'03 | Since Q1'04 | |
| MFG-OtLk | -63.0 | -48.0 | -25.0 | -15.0 | -37.8 | -8.2 | 0.0% |
| NonMFG -Otlk | -52.0 | -42.0 | -31.0 | -27.0 | -38.0 | -19.0 | 0.0% |
| All Industry-Otlk | -56.0 | -44.0 | -29.0 | -22.0 | -37.8 | -15.1 | 0.0% |

Tom Moeller
AuthorMore in Author Profile »Prior to joining Haver Analytics in 2000, Mr. Moeller worked as the Economist at Chancellor Capital Management from 1985 to 1999. There, he developed comprehensive economic forecasts and interpreted economic data for equity and fixed income portfolio managers. Also at Chancellor, Mr. Moeller worked as an equity analyst and was responsible for researching and rating companies in the economically sensitive automobile and housing industries for investment in Chancellor’s equity portfolio. Prior to joining Chancellor, Mr. Moeller was an Economist at Citibank from 1979 to 1984. He also analyzed pricing behavior in the metals industry for the Council on Wage and Price Stability in Washington, D.C. In 1999, Mr. Moeller received the award for most accurate forecast from the Forecasters' Club of New York. From 1990 to 1992 he was President of the New York Association for Business Economists. Mr. Moeller earned an M.B.A. in Finance from Fordham University, where he graduated in 1987. He holds a Bachelor of Arts in Economics from George Washington University.
More Economy in Brief


