 Global| Feb 27 2004
4Q U.S. GDP Growth Revised Up
by:Tom Moeller
|in:Economy in Brief
Summary
US economic growth last quarter was unexpectedly revised higher to 4.1% versus expectations for a slight downward revision. Inventories contributed a greater 0.9 percentage points to 4Q GDP growth versus the advance estimate of a 0.6 [...]
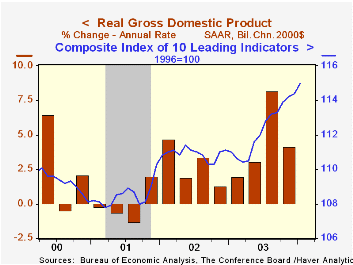
US economic growth last quarter was unexpectedly revised higher to 4.1% versus expectations for a slight downward revision.
Inventories contributed a greater 0.9 percentage points to 4Q GDP growth versus the advance estimate of a 0.6 point contribution.
Growth in nonresidential fixed investment also was revised higher to 9.6% (7.1% y/y) from 9.0% reported initially. Investment in equipment & software was revised up to 15.1% versus the advance report of an 11.5% surge.
Overall, domestic final demand growth was revised to 3.3% from 3.1%. Growth in real PCE was about unchanged at 2.7% versus 6.9% in 3Q. Residential investment grew 8.6% (AR).
Offsetting these upward revisions was the foreign trade sector which subtracted 0.3 percentage points instead of adding 0.2 points to GDP growth. Export growth of 21.0% was slightly faster than originally estimated, but import growth was revised up to 16.4% from 11.3%.
Inflation was revised slightly higher to a tame 1.2%.
Analysis titled "Globalization and Global Disinflation" from the Federal Reserve Bank of Kansas City is available here.
| Chained 2000$, % AR | 4Q '03 (Prelim) |
4Q '03 (Advance) |
3Q'03 | Y/Y | 2003 | 2002 | 2001 |
|---|---|---|---|---|---|---|---|
| GDP | 4.1% | 4.0% | 8.2% | 4.3% | 3.1% | 2.2% | 0.5% |
| Inventory Effect | 0.9% | 0.6% | -0.1% | -0.1% | -0.1% | 0.4% | -0.9% |
| Final Sales | 3.2% | 3.4% | 8.3% | 4.4% | 3.1% | 1.8% | 1.4% |
| Trade Effect | -0.3% | 0.2% | 0.8% | 0.3% | -0.1% | -0.6% | -0.2% |
| Domestic Final Demand | 3.3% | 3.1% | 7.2% | 4.2% | 3.4% | 2.4% | 1.6% |
| Chained GDP Price Index | 1.2% | 1.1% | 1.6% | 1.5% | 1.7% | 1.5% | 2.4% |
by Tom Moeller February 27, 2004
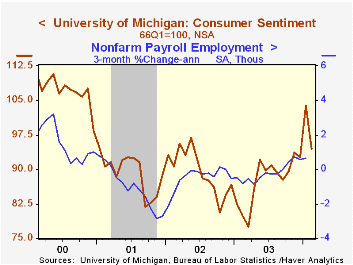
The University of Michigan’s consumer sentiment index for the full month of February came in at 94.4 versus the mid-month read of 93.1. Nevertheless, sentiment still fell 9.1% from January. Consensus expectations had been for a February reading of 94.0.
During the last ten years there has been an 75% correlation between the level of consumer sentiment and the y/y change in real PCE. That correlation has risen to 84% during the last five years.
Perceptions of current economic conditions improved as the full month index came in at 103.6 versus 100.4 mid-month. The 5.4% m/m slide followed a 12.9% rise in January.
The expectations index dropped 11.6% m/m, about the same as the mid-month reading.
The University of Michigan survey is not seasonally adjusted.It is based on telephone interviews with 250 households nationwide on personal finances and business and buying conditions. The survey is expanded to a total of 500 interviews at month end.
| University of Michigan | Feb | Jan | Y/Y | 2003 | 2002 | 2001 |
|---|---|---|---|---|---|---|
| Consumer Sentiment | 94.4 | 103.8 | 18.1% | 87.6 | 89.6 | 89.2 |
| Current Conditions | 103.6 | 109.5 | 8.6% | 97.2 | 97.5 | 100.1 |
| Consumer Expectations | 88.5 | 100.1 | 26.6% | 81.4 | 84.6 | 82.3 |
by Tom Moeller February 27, 2004
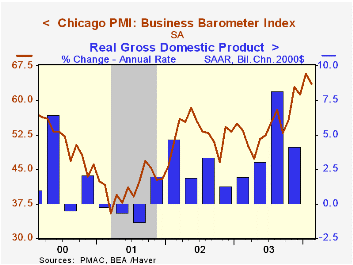
The February Chicago Purchasing Managers Business Barometer fell slightly to 63.6 from the near-ten year high of 65.9 in January. That matched Consensus expectations for a reading of 63.5.
During the last twenty years there has been a 52% correlation between the level of the Chicago PMI and quarterly growth in real GDP.
The new orders index fell to 67.5 from 69.7 in January. The Jan-Feb average of 68.6 is versus a 4Q average of 65.4.
Production fell to 73.0 from 76.5 in January. The 74.7 average is versus 68.9 in 4Q.
Employment surged to 54.8, the highest level since April 1998. During the last ten years there has been a 69% correlation between the level of the employment index and the y/y change in payroll employment.
The index of prices paid fell slightly to a still-high 66.9.
| Chicago Purchasing Managers Index, SA | Feb 04 | Jan 04 | Feb 03 | 2003 | 2002 | 2001 |
|---|---|---|---|---|---|---|
| Business Barometer | 63.6 | 65.9 | 53.6 | 54.7 | 52.7 | 41.4 |
| New Orders | 67.5 | 69.7 | 57.1 | 58.0 | 56.2 | 42.3 |
| Prices Paid | 66.9 | 67.8 | 54.8 | 55.8 | 56.9 | 50.4 |

Tom Moeller
AuthorMore in Author Profile »Prior to joining Haver Analytics in 2000, Mr. Moeller worked as the Economist at Chancellor Capital Management from 1985 to 1999. There, he developed comprehensive economic forecasts and interpreted economic data for equity and fixed income portfolio managers. Also at Chancellor, Mr. Moeller worked as an equity analyst and was responsible for researching and rating companies in the economically sensitive automobile and housing industries for investment in Chancellor’s equity portfolio. Prior to joining Chancellor, Mr. Moeller was an Economist at Citibank from 1979 to 1984. He also analyzed pricing behavior in the metals industry for the Council on Wage and Price Stability in Washington, D.C. In 1999, Mr. Moeller received the award for most accurate forecast from the Forecasters' Club of New York. From 1990 to 1992 he was President of the New York Association for Business Economists. Mr. Moeller earned an M.B.A. in Finance from Fordham University, where he graduated in 1987. He holds a Bachelor of Arts in Economics from George Washington University.
More Economy in Brief


