Global| Nov 25 2003
3Q U.S. GDP Revised to 8.2%, Profits Exploded
by:Tom Moeller
|in:Economy in Brief
Summary
US economic growth last quarter was revised upward to 8.2% (AR). Consensus expectations had been for a revision to 7.8%. Corporate profits w/IVA & CCA exploded, rising at a 56.0% annual rate (30.0% y/y. That followed a 45.7% gain in [...]
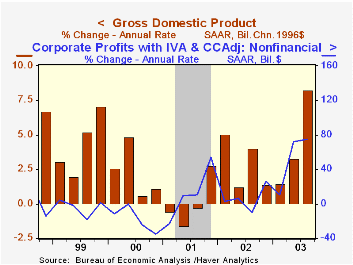
US economic growth last quarter was revised upward to 8.2% (AR). Consensus expectations had been for a revision to 7.8%.
Corporate profits w/IVA & CCA exploded, rising at a 56.0% annual rate (30.0% y/y. That followed a 45.7% gain in 2Q. The burst came as profits after tax jumped 49.8% (13.6% y/y), the biggest quarterly jump since 4Q 1992. Profits in the nonfinancial corporate sector (calculated from the income side of the NIPA) jumped at a 75.2% rate (43.2% y/y).
The GDP revision stemmed primarily from inventories. Slight accumulation, the first since 4Q02, is now shown adding 0.2 percentage points to output growth instead of subtracting 0.7 points.
Domestic final demand growth also was revised upward to 6.8% from 6.6% as business investment in equipment & software was revised to 18.4%, the fastest since 4Q 1998. Growth in residential investment also was revised up to 22.7% but PCE growth was lowered slightly to 6.4%.
Improvement in the foreign trade deficit was unrevised and it added 0.8 percentage points to GDP growth. Export growth was revised up to 11.0% and imports were revised up less to 1.5%.
Inflation was revised down slightly to 1.7%. The PCE price deflator was up 2.3% but excluding food and energy rose just 1.0% (1.2% y/y).
| Chained '96 $, % AR | 3Q'03 (Prelim.) | 3Q'03 (Advance) | 2Q'03 | Y/Y | 2002 | 2001 |
|---|---|---|---|---|---|---|
| GDP | 8.2% | 7.2% | 3.3% | 3.5% | 2.4% | 0.3% |
| Inventory Effect | 0.2% | -0.7% | -0.7% | -0.3% | 0.6% | -1.2% |
| Final Sales | 8.0% | 7.8% | 4.0% | 3.8% | 1.8% | 1.5% |
| Trade Effect | 0.8% | 0.8% | -1.3% | -0.2% | -0.7% | -0.2% |
| Domestic Final Demand | 6.8% | 6.6% | 5.1% | 4.0% | 2.4% | 1.6% |
| Chained GDP Price Deflator | 1.7% | 1.8% | 1.0% | 1.7% | 1.1% | 2.4% |
by Tom Moeller November 25, 2003
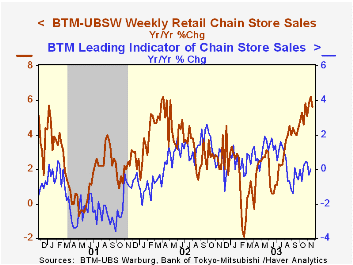
Chain store sales rose 0.4% and gained back half of the 0.8% drop the week prior according to the BTM-UBSW survey.
So far in November sales are 0.5% ahead of last month's average. That followed a 0.6% m/m decline during all of October.
During the last five years there has been a 61% correlation between the year-to-year percent change in the BTM-UBSW measure of chain store sales and the change in non-auto retail sales less gasoline.
The BTM-UBSW retail chain-store sales index is constructed using the same-store sales reported by 78 stores of seven retailers: Dayton Hudson, Federated, Kmart, May, J.C. Penney, Sears and Wal-Mart.
| BTM-UBSW (SA, 1977=100) | 11/22/03 | 11/15/03 | Y/Y | 2002 | 2001 | 2000 |
|---|---|---|---|---|---|---|
| Total Weekly Retail Chain Store Sales | 423.3 | 421.7 | 5.6% | 3.6% | 2.1% | 3.4% |
by Tom Moeller November 25, 2003
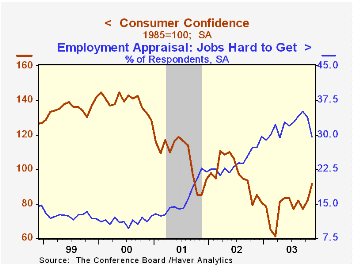
The Conference Board’s Index of Consumer Confidence rose to 91.7 in November, the highest level in over a year. Consensus estimates were for a gain to 84.0 and October's level was revised up slightly.
The expectations index jumped to 99.4 from 91.5 in October, the highest level since June 2002. The reading of the present situation jumped for the second month to 80.1.
The 12.2% m/m rise in Confidence outpaced the 4.4% November increase in Consumer Sentiment reported by the University of Michigan.
Jobs were viewed as hard to get by 29.5% of respondents, the lowest since April. The appraisal of the present situation improved to its best since the summer of 2002.
The Conference Board’s survey isconducted by a mailed questionnaire to 5,000 households and about 3,500 typically respond.
| Conference Board | Nov | Oct | Y/Y | 2002 | 2001 | 2000 |
|---|---|---|---|---|---|---|
| Consumer Confidence | 91.7 | 81.7 | 8.0% | 96.6 | 106.6 | 139.0 |
by Tom Moeller November 25, 2003
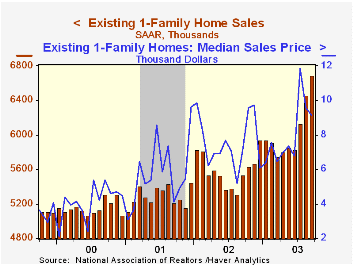
Sales of existing single family homes reported by the National Association of Realtors fell 4.9% in October to 6.35M. The decline was greater than Consensus expectations.
Record sales in September were revised down slightly. The figures reflect closings of home sales in earlier months.
Sales fell across the nation. In the Northeast sales fell 2.7% (10.6% y/y). In the West sales fell 9.2% to 1.68M (12.8% y/y). Sales in the Midwest were down 4.9% (9.7% y/y) and in the South sales fell 2.7% to 2.57M (14.7% y/y).
The median price of an existing home rose m/m to $172,400 (+8.2% y/y) but the prior month was revised down.
The latest release from the National Association of Realtors is available here.
| Existing Home Sales (000, AR) | Oct | Sept | Y/Y | 2002 | 2001 | 2000 |
|---|---|---|---|---|---|---|
| Existing Single-Family | 6,350 | 6,6680 | 12.8% | 5,595 | 5,292 | 5,158 |

Tom Moeller
AuthorMore in Author Profile »Prior to joining Haver Analytics in 2000, Mr. Moeller worked as the Economist at Chancellor Capital Management from 1985 to 1999. There, he developed comprehensive economic forecasts and interpreted economic data for equity and fixed income portfolio managers. Also at Chancellor, Mr. Moeller worked as an equity analyst and was responsible for researching and rating companies in the economically sensitive automobile and housing industries for investment in Chancellor’s equity portfolio. Prior to joining Chancellor, Mr. Moeller was an Economist at Citibank from 1979 to 1984. He also analyzed pricing behavior in the metals industry for the Council on Wage and Price Stability in Washington, D.C. In 1999, Mr. Moeller received the award for most accurate forecast from the Forecasters' Club of New York. From 1990 to 1992 he was President of the New York Association for Business Economists. Mr. Moeller earned an M.B.A. in Finance from Fordham University, where he graduated in 1987. He holds a Bachelor of Arts in Economics from George Washington University.
More Economy in Brief