 Global| Oct 30 2003
3Q U.S. GDP Growth Surged To 7.2%
by:Tom Moeller
|in:Economy in Brief
Summary
The US economy grew at a 7.2% annual rate last quarter, the fastest since early 1984. Consensus expectations had been for 6.0% growth. Domestic final demand jumped at a 6.6% rate, the fastest since 3Q97, led by a 15.4% (6.0% y/y) [...]
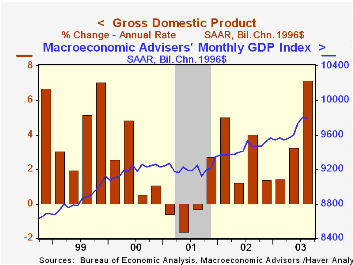
The US economy grew at a 7.2% annual rate last quarter, the fastest since early 1984. Consensus expectations had been for 6.0% growth.
Domestic final demand jumped at a 6.6% rate, the fastest since 3Q97, led by a 15.4% (6.0% y/y) spike in business investment in equipment & software. Residential investment also surged at a 20.4% rate (11.5% y/y).
Consumer spending grew at a 6.6% (3.5% y/y) rate while government spending slowed to a 1.3% (3.7% y/y) rate of gain.
Inventories and foreign trade had roughly offsetting effects on GDP growth last quarter. Continued inventory decumulation subtracted 0.7 percentage points but improvement in the net exports added 0.8 percentage points to GDP growth. Exports jumped at a 9.3% rate (0.1% y/y), outpacing imports which rose at just a 0.1% (2.3% y/y) rate.
Inflation picked up somewhat to 1.8% last quarter due to higher energy prices which boosted growth in the PCE price deflator to a 2.4% growth rate. The price index for domestic final demand grew at a 1.9% rate (1.9% y/y).
A report from the Federal Reserve Bank of St. Louis titled "The Less Volatile U.S. Economy" is available here.
| Chained '96 $, % AR | 3Q'03 (Advance) | 2Q'03 | Y/Y | 2002 | 2001 | 2000 |
|---|---|---|---|---|---|---|
| GDP | 7.2% | 3.3% | 3.3% | 2.4% | 0.3% | 3.8% |
| Inventory Effect | -0.7% | -0.7% | -0.5% | 0.6% | -1.2% | 0.1% |
| Final Sales | 7.8% | 4.0% | 3.8% | 1.8% | 1.5% | 3.7% |
| Trade Effect | 0.8% | -1.3% | -0.1% | -0.7% | -0.2% | -0.7% |
| Domestic Final Demand | 6.6% | 5.1% | 3.9% | 2.4% | 1.6% | 4.3% |
| Chained GDP Price Deflator | 1.8% | 1.0% | 1.7% | 1.1% | 2.4% | 2.1% |
by Tom Moeller October 30, 2003
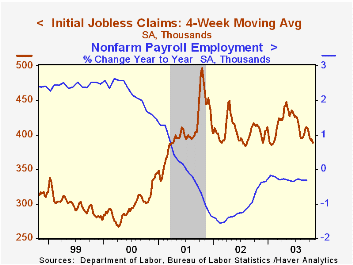
Initial claims for jobless insurance fell 5,000 to 386,000 last week. The modest decline reported initially for last week was revised to a slight increase. Consensus expectations had been for claims of 385,000.
The four-week moving average of initial claims fell to 388,750 (-5.9% y/y).
Continuing claims for unemployment insurance rose 57,000 but the 84,000 decline initially reported for the prior week was deepened to a decline of 116,000.
The insured rate of unemployment was stable at 2.8%.
| Unemployment Insurance (000s) | 10/25/03 | 10/18/03 | Y/Y | 2002 | 2001 | 2000 |
|---|---|---|---|---|---|---|
| Initial Claims | 386.0 | 391.0 | -7.2% | 404.3 | 406.0 | 299.7 |
| Continuing Claims | -- | 3,566 | -0.4% | 3,575 | 3,022 | 2,114 |
by Tom Moeller October 30, 2003
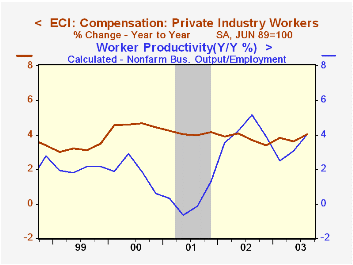
The employment cost index for workers in private industry rose 1.0% last quarter. That pulled the y/y rate of growth in compensation to 4.0%, a recovery from the weak 3.2% y/y growth at year end 2002.
Benefit costs again paced the gain in total compensation, up 1.4% (6.5% y/y). Growth in blue-collar benefit costs surged 1.3% q/q and were up 7.3% y/y. That was led by a 1.6% gain in factory sector benefits, up 8.6% y/y.
Wages and salaries, which account for roughly 70% of the compensation index, rose 0.9% (3.0% y/y). Wage growth in blue-collar occupations has decelerated to 2.6% y/y from 4.0% in early 2001. Wage growth in white-collar occupations was 3.3% y/y last quarter versus 4.5% in early 2001.
| ECI- Private Industry Workers | 3Q'03 | 2Q'03 | Y/Y | 2002 | 2001 | 2000 |
|---|---|---|---|---|---|---|
| Compensation | 1.0% | 0.8% | 4.0% | 3.2% | 4.2% | 4.4% |
| Wages & Salaries | 0.9% | 0.6% | 3.0% | 2.7% | 3.8% | 3.9% |
| Benefit Costs | 1.4% | 1.3% | 6.5% | 4.7% | 5.1% | 5.6% |
by Tom Moeller October 30, 2003
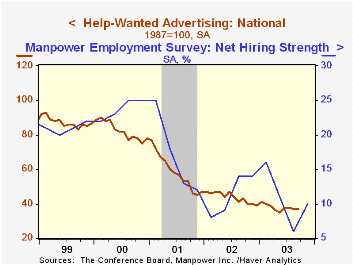
The Conference Board’s National Index of Help-Wanted Advertising remained at 37 last month, the midpoint of a depressed range of readings in place since March.
During the last ten years there has been a 93% correlation between the level of help-wanted advertising and the year-to-year change in non-farm payrolls.
The proportion of labor markets with rising want-ad volume fell to 41% from an upwardly revised August reading of 49%.
The Conference Board surveys help-wanted advertising volume in 51 major newspapers across the country every month.
| Conference Board | Sept | Aug | Sept '02 |
|---|---|---|---|
| National Help Wanted Index | 37 | 37 | 43 |

Tom Moeller
AuthorMore in Author Profile »Prior to joining Haver Analytics in 2000, Mr. Moeller worked as the Economist at Chancellor Capital Management from 1985 to 1999. There, he developed comprehensive economic forecasts and interpreted economic data for equity and fixed income portfolio managers. Also at Chancellor, Mr. Moeller worked as an equity analyst and was responsible for researching and rating companies in the economically sensitive automobile and housing industries for investment in Chancellor’s equity portfolio. Prior to joining Chancellor, Mr. Moeller was an Economist at Citibank from 1979 to 1984. He also analyzed pricing behavior in the metals industry for the Council on Wage and Price Stability in Washington, D.C. In 1999, Mr. Moeller received the award for most accurate forecast from the Forecasters' Club of New York. From 1990 to 1992 he was President of the New York Association for Business Economists. Mr. Moeller earned an M.B.A. in Finance from Fordham University, where he graduated in 1987. He holds a Bachelor of Arts in Economics from George Washington University.
More Economy in Brief


