 Global| Oct 31 2002
3Q GDP Growth Firm
by:Tom Moeller
|in:Economy in Brief
Summary
Real GDP last quarter grew slightly less than Consensus expectations for a 3.5% (AR) rise. Nevertheless it was the second strongest quarterly rate of growth since 2Q 2000. Domestic final demand growth of 3.2% was paced by 4.2% growth [...]
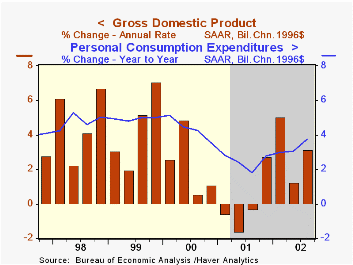
Real GDP last quarter grew slightly less than Consensus expectations for a 3.5% (AR) rise. Nevertheless it was the second strongest quarterly rate of growth since 2Q 2000.
Domestic final demand growth of 3.2% was paced by 4.2% growth in consumer spending. That was led by a 48.0% rise in motor vehicle purchases. Residential investment actually fell a slight 0.7% as construction spending on residential buildings was down in July & August versus 2Q.
Capital spending rose a slight 0.6%, the first gain in two years. Spending on equipment rose 6.5% and was paced by a 13.0% rise in spending on information processing equipment & software, the third consecutive quarterly gain. Business spending on structures fell sharply (-16.0%) for the sixth quarter in seven.
Trade sector deterioration was negligible due to only slight gains in exports (2.2%) and imports (2.5%).
Production was barely negative in it's effect on inventory accumulation.
Estimated inflation has been about stable in the first three quarters of this year.
| Chained '96 $, % AR | 3Q'02 (Advance) | 2Q'02 (Final) | Y/Y | 2001 | 2000 | 1999 |
|---|---|---|---|---|---|---|
| GDP | 3.1% | 1.3% | 3.0% | 0.3% | 3.8% | 4.1% |
| Inventory Effect | -0.1% | 1.3% | 0.6% | -1.2% | 0.1% | -0.2% |
| Final Sales | 3.2% | -0.1% | 2.4% | 1.5% | 3.7% | 4.3% |
| Trade Effect | -0.1% | -1.4% | -0.5% | -0.1% | -0.6% | -0.9% |
| Domestic Final Demand | 3.2% | 1.3% | 2.9% | 1.6% | 4.3% | 5.2% |
| Chained GDP Price Deflator | 1.1% | 1.2% | 0.8% | 2.4% | 2.1% | 1.4% |
by Tom Moeller October 31, 2002

The employment cost index rose less than Consensus expectations for a 0.9% gain. It was the weakest quarterly gain in the ECI since 1Q 1999.
The gain in wages & salaries eased sharply even as the unemployment rate fell last quarter. The gain in benefit costs also dropped to the lowest since 3Q 1999.
Compensation gains in service occupations rebounded from the sharp deceleration last quarter. Compensation gains in the goods producing sector decelerated sharply.
For a discussion by the San Francisco Fed of the Phillips Curve and inflation, click here.
| ECI- Private Industry Workers | 3Q'02 | 2Q'02 | Y/Y | 2001 | 2000 | 1999 |
|---|---|---|---|---|---|---|
| Compensation | 0.6% | 1.1% | 3.7% | 4.2% | 4.4% | 3.4% |
| Wages & Salaries | 0.4% | 1.0% | 3.2% | 3.8% | 3.9% | 3.5% |
| Benefit Costs | 1.0% | 1.4% | 4.8% | 5.1% | 5.6% | 3.4% |
by Tom Moeller October 31, 2002
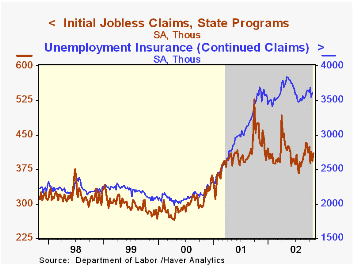
Initial claims for unemployment insurance rose slightly more than expected in the latest week. Claims in the prior week were revised up slightly.
The four-week moving average of initial claims fell to 401,750, down 14.4% y/y.
Continuing claims for unemployment insurance rose 2.1%, reversing about half of prior week's sharp decline. The prior week's levelwas revised down.
The weekly insured rate of unemployment was stable at 2.8%.
| Unemployment Insurance (000s) | 10/26/02 | 10/19/02 | Y/Y | 2001 | 2000 | 1999 |
|---|---|---|---|---|---|---|
| Initial Claims | 410.0 | 394.0 | -13.9% | 405.8 | 299.8 | 297.7 |
| Continuing Claims | -- | 3,620 | 0.6% | 3,021 | 2,114 | 2,186 |
by Tom Moeller October 31, 2002

The Chicago Purchasing Manager’s Index of Business activity was weaker than expected in October. Consensus estimates were for slight rise to 49.5.
It was the second consecutive decline in the business activity index and the second month below 50, the cutoff between expanding and contracting activity.
An 86% correlation over the last ten years between the Chicago PMI and the ISM Composite Index suggests the ISM index may be weak when released tomorrow.
The indexes of new orders, production, order backlogs, and employment all fell. Delivery speeds and inventories were up.
The prices paid index rose and reversed most of its September decline.
Visit the Chicago Purchasing Managers website at www.napm-chicago.org.
| Chicago Purchasing Managers Index, SA | Oct | Sept | Y/Y | 2001 | 2000 | 1999 |
|---|---|---|---|---|---|---|
| Business Barometer | 45.9 | 48.1 | 44.6 | 41.4 | 51.8 | 56.5 |
| Prices Paid | 62.0 | 57.6 | 40.1 | 50.5 | 65.6 | 57.6 |
by Tom Moeller October 31, 2002
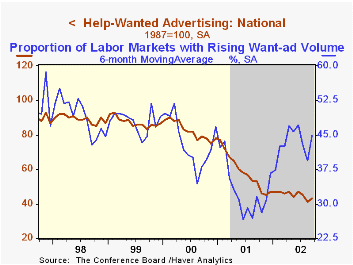
The Conference Board's National Index of Help-Wanted Advertising in September recouped half of its sharp drop the prior month. Nevertheless, the index remained down 4 points, or 8.5%, from yearend 2001.
The proportion of labor markets with rising want-ad volume improved sharply to 76%, the second highest level since 1999.
During the last five years there has been a 76% correlation between the level of help-wanted advertising and the monthly change in nonfarm payrolls. The correlation with the y/y change in employment has been 98%
Job opportunities improved in most of the regions of the country.
The figures are seasonally adjusted.
| Conference Board | Sept | Aug | Sept '01 |
|---|---|---|---|
| National Help Wanted Index | 43 | 41 | 53 |

Tom Moeller
AuthorMore in Author Profile »Prior to joining Haver Analytics in 2000, Mr. Moeller worked as the Economist at Chancellor Capital Management from 1985 to 1999. There, he developed comprehensive economic forecasts and interpreted economic data for equity and fixed income portfolio managers. Also at Chancellor, Mr. Moeller worked as an equity analyst and was responsible for researching and rating companies in the economically sensitive automobile and housing industries for investment in Chancellor’s equity portfolio. Prior to joining Chancellor, Mr. Moeller was an Economist at Citibank from 1979 to 1984. He also analyzed pricing behavior in the metals industry for the Council on Wage and Price Stability in Washington, D.C. In 1999, Mr. Moeller received the award for most accurate forecast from the Forecasters' Club of New York. From 1990 to 1992 he was President of the New York Association for Business Economists. Mr. Moeller earned an M.B.A. in Finance from Fordham University, where he graduated in 1987. He holds a Bachelor of Arts in Economics from George Washington University.
More Economy in Brief


