 Global| May 01 2003
1Q Productivity Up
by:Tom Moeller
|in:Economy in Brief
Summary
Nonfarm labor productivity last quarter grew slightly less than expected, up 1.6% versus a Consensus estimate for 2.0% growth. Productivity growth, though slow, accelerated versus 4Q despite slower growth in output. Output rose 1.4% [...]
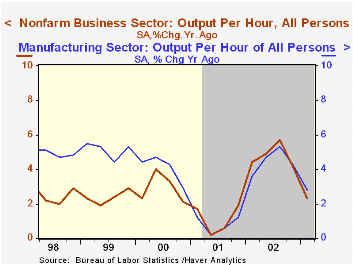
Nonfarm labor productivity last quarter grew slightly less than expected, up 1.6% versus a Consensus estimate for 2.0% growth.
Productivity growth, though slow, accelerated versus 4Q despite slower growth in output. Output rose 1.4% last quarter and 1.7% in 4Q02. Hours worked fell 0.1% after a 0.9% 4Q gain.
Unit labor cost growth decelerated to 1.9% from 3.2% in 4Q. Growth in compensation remained relatively firm at 3.5% versus 3.9% in 4Q. During the last ten years there has been a 60% (inverse) correlation between the year-to-year growth in unit labor costs and after tax operating corporate profits.
Manufacturing sector productivity growth recovered to 2.1% (2.8% y/y) following a 0.5% decline in 4Q. The rise lowered the gain in unit labor costs to 2.7% from 5.9% in 4Q.
Analysis from the Federal Reserve Bank of Philadelphia of ways to promote creativity and innovation can be found here.
Technological change is explored in this paper by the Federal Reserve Bank of San Francisco.
| Nonfarm Business Sector (SAAR) | 1Q '03 Prelim. | 4Q '02 Final | Y/Y | 2002 | 2001 | 2000 |
|---|---|---|---|---|---|---|
| Output per Hour | 1.6% | 0.7% | 2.3% | 4.8% | 1.1% | 2.9% |
| Compensation | 3.5% | 3.9% | 3.3% | 2.4% | 2.7% | 7.0% |
| Unit Labor Costs | 1.9% | 3.2% | 0.9% | -2.3% | 1.6% | 3.9% |
by Tom Moeller May 1, 2003
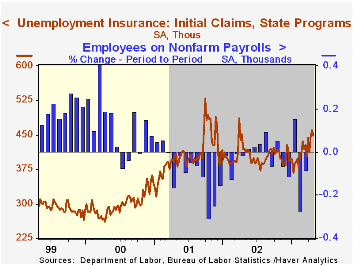
Initial claims for unemployment insurance last week fell less than Consensus expectations. Initial claims fell 2.8% w/w to 448,000. That reversed a 3.1% rise the week earlier which was revised up.
The four-week moving average of initial claims rose to 442,000 (2.3% y/y), the highest level since April of last year.
During the last ten years there has been a 66% correlation (inverse) between the level of initial claims and the month to month change in nonfarm payrolls. The latest claims figures are consistent with a slight decline in April payrolls, to be released tomorrow.
Continuing claims for unemployment insurance rose 3.1% w/w to the highest level since early-October. The prior week's figure was revised down.
The insured rate of unemployment rose to 2.9%, the highest level since early October.
| Unemployment Insurance (000s) | 4/26/03 | 4/19/03 | Y/Y | 2002 | 2001 | 2000 |
|---|---|---|---|---|---|---|
| Initial Claims | 448.0 | 461.0 | 6.9% | 404.3 | 406.0 | 299.7 |
| Continuing Claims | -- | 3,679 | 0.4% | 3,575 | 3,022 | 2,114 |
by Tom Moeller May 1, 2003
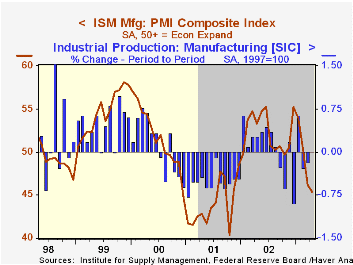
The ISM Composite Index of manufacturing sector activity fell to 45.4 last month. It was the second month the index was below 50 since October and thus indicated another decline in factory sector activity.
Consensus expectations were for a reading of 47.0.
During the last ten years there has been a 51% correlation between the level of the ISM index and the month to month change in factory sector industrial production.
Three of the five composite index's component series declined last month. New orders, employment and the vendor delivery index were down. Production and inventories each rose but just slightly to levels that still suggested contraction.
The separate index of inflation pressure fell for the first month since November. This index is not seasonally adjusted.
| ISM Manufacturing Survey | April | Mar | Y/Y | 2002 | 2001 | 2000 |
|---|---|---|---|---|---|---|
| Composite Index | 45.4 | 46.2 | 53.3 | 52.4 | 44.0 | 51.7 |
| Prices Paid Index (NSA) | 63.5 | 70.0 | 62.5 | 57.6 | 42.9 | 64.8 |
by Tom Moeller May 1, 2003
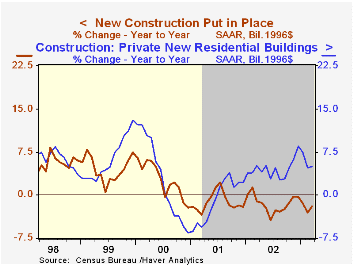
The value of construction put in place fell a sharp 1.0% in March versus consensus expectations for a slight rise. The slight decline in February spending was revised to a slight rise.
Lower levels of public and of nonresidential construction recently accounted for much of weakness in total construction spending.
In constant 1996 dollars, overall construction spending fell 1.1% (-2.0% y/y) in March. Real public spending fell 3.6% (-2.9% y/y). Real nonresidential activity fell 0.2% (-11.8% y/y).
In addition to those declines, growth in residential building expenditures slowed appreciably. In March, real residential spending was unchanged following a 0.2% February gain. Year-to-year growth fell to 5.0% from a high of 8.5% at the end of last year.
| Construction Put-in-place | Mar | Feb | Y/Y | 2002 | 2001 | 2000 |
|---|---|---|---|---|---|---|
| Total | -1.0% | 0.2% | 1.6% | 0.7% | 2.5% | 7.3% |
| Residential | 0.1% | 0.8% | 9.7% | 7.1% | 3.3% | 7.4% |
| Nonresidential | -0.2% | 0.6% | -9.5% | -16.4% | -3.1% | 7.1% |
| Public | -3.5% | -2.1% | -0.3% | 6.2% | 7.4% | 5.4% |

Tom Moeller
AuthorMore in Author Profile »Prior to joining Haver Analytics in 2000, Mr. Moeller worked as the Economist at Chancellor Capital Management from 1985 to 1999. There, he developed comprehensive economic forecasts and interpreted economic data for equity and fixed income portfolio managers. Also at Chancellor, Mr. Moeller worked as an equity analyst and was responsible for researching and rating companies in the economically sensitive automobile and housing industries for investment in Chancellor’s equity portfolio. Prior to joining Chancellor, Mr. Moeller was an Economist at Citibank from 1979 to 1984. He also analyzed pricing behavior in the metals industry for the Council on Wage and Price Stability in Washington, D.C. In 1999, Mr. Moeller received the award for most accurate forecast from the Forecasters' Club of New York. From 1990 to 1992 he was President of the New York Association for Business Economists. Mr. Moeller earned an M.B.A. in Finance from Fordham University, where he graduated in 1987. He holds a Bachelor of Arts in Economics from George Washington University.
More Economy in Brief


